![]()
STATS19 reported road casualties: LA region of Bristol
Introduction
This is a report for the Local Authority (LA) region of Bristol, which can be reproduced for any LA by cloning the repository at https://github.com/blaisekelly/stats19_stats.
The LA boundary is shown on this plot of the cycle network (from OSM data processed with the osmactive package).
In this report all serious and slight casualty data is based on the adjusted data.
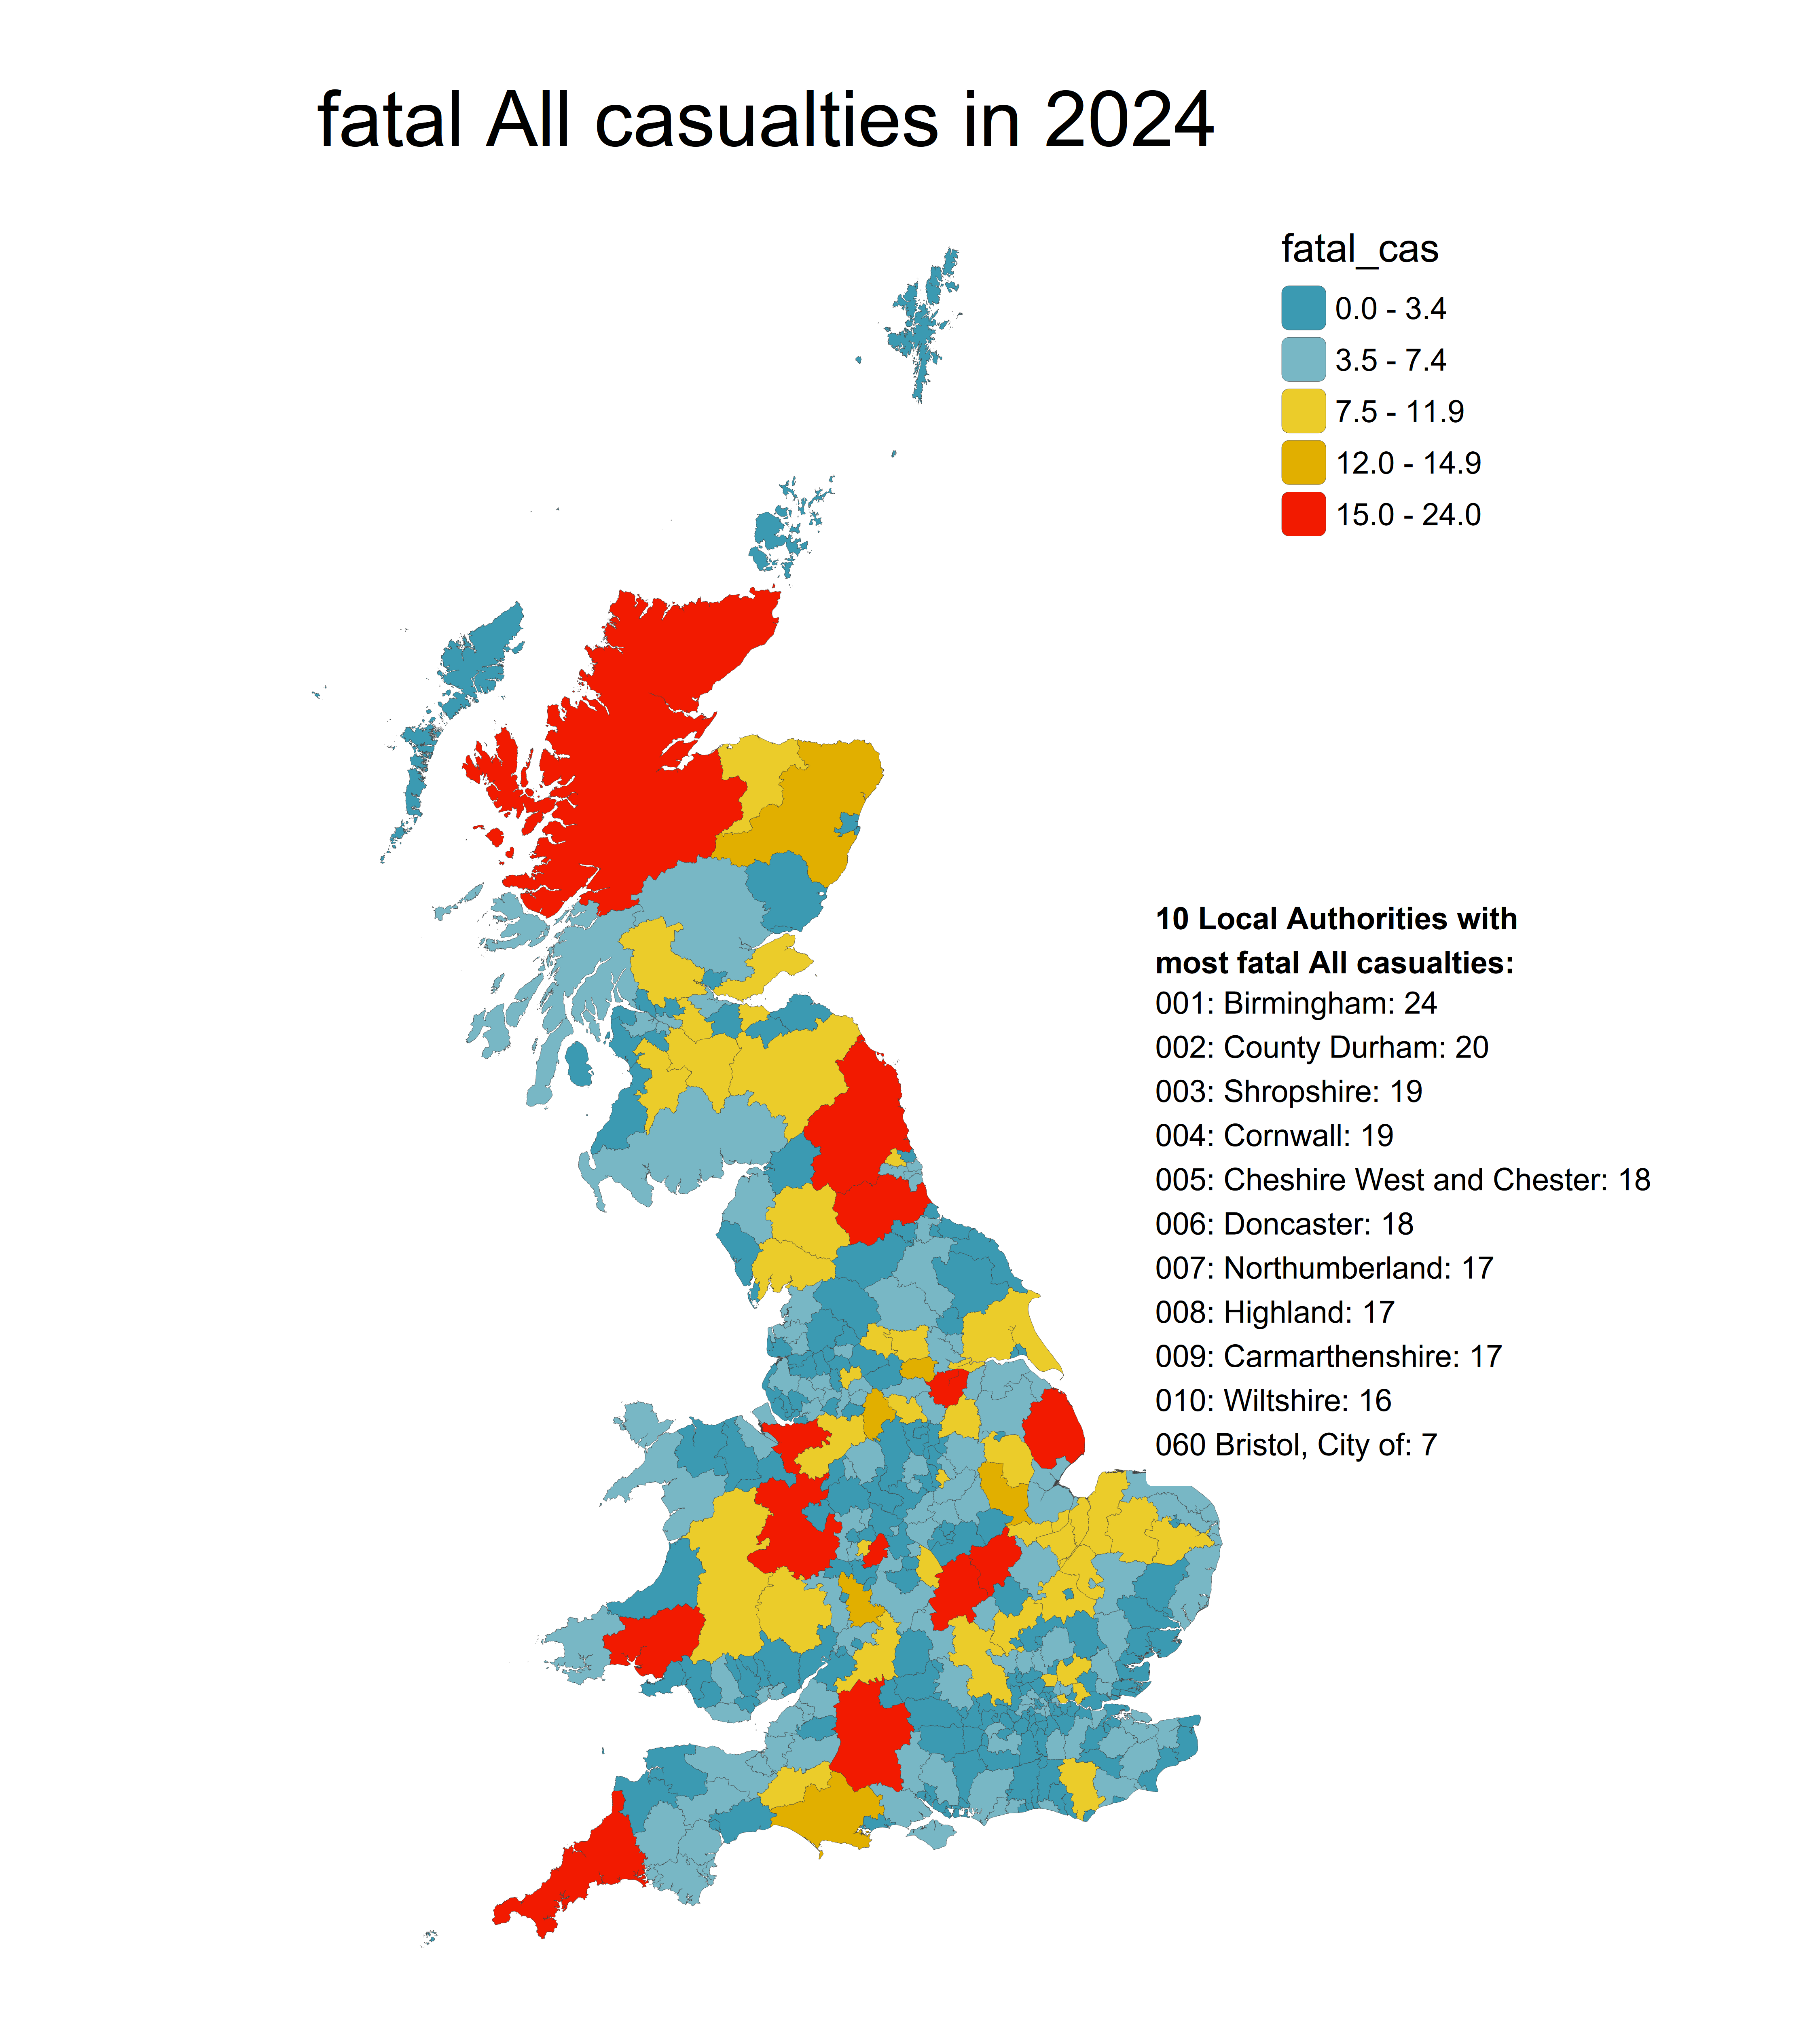
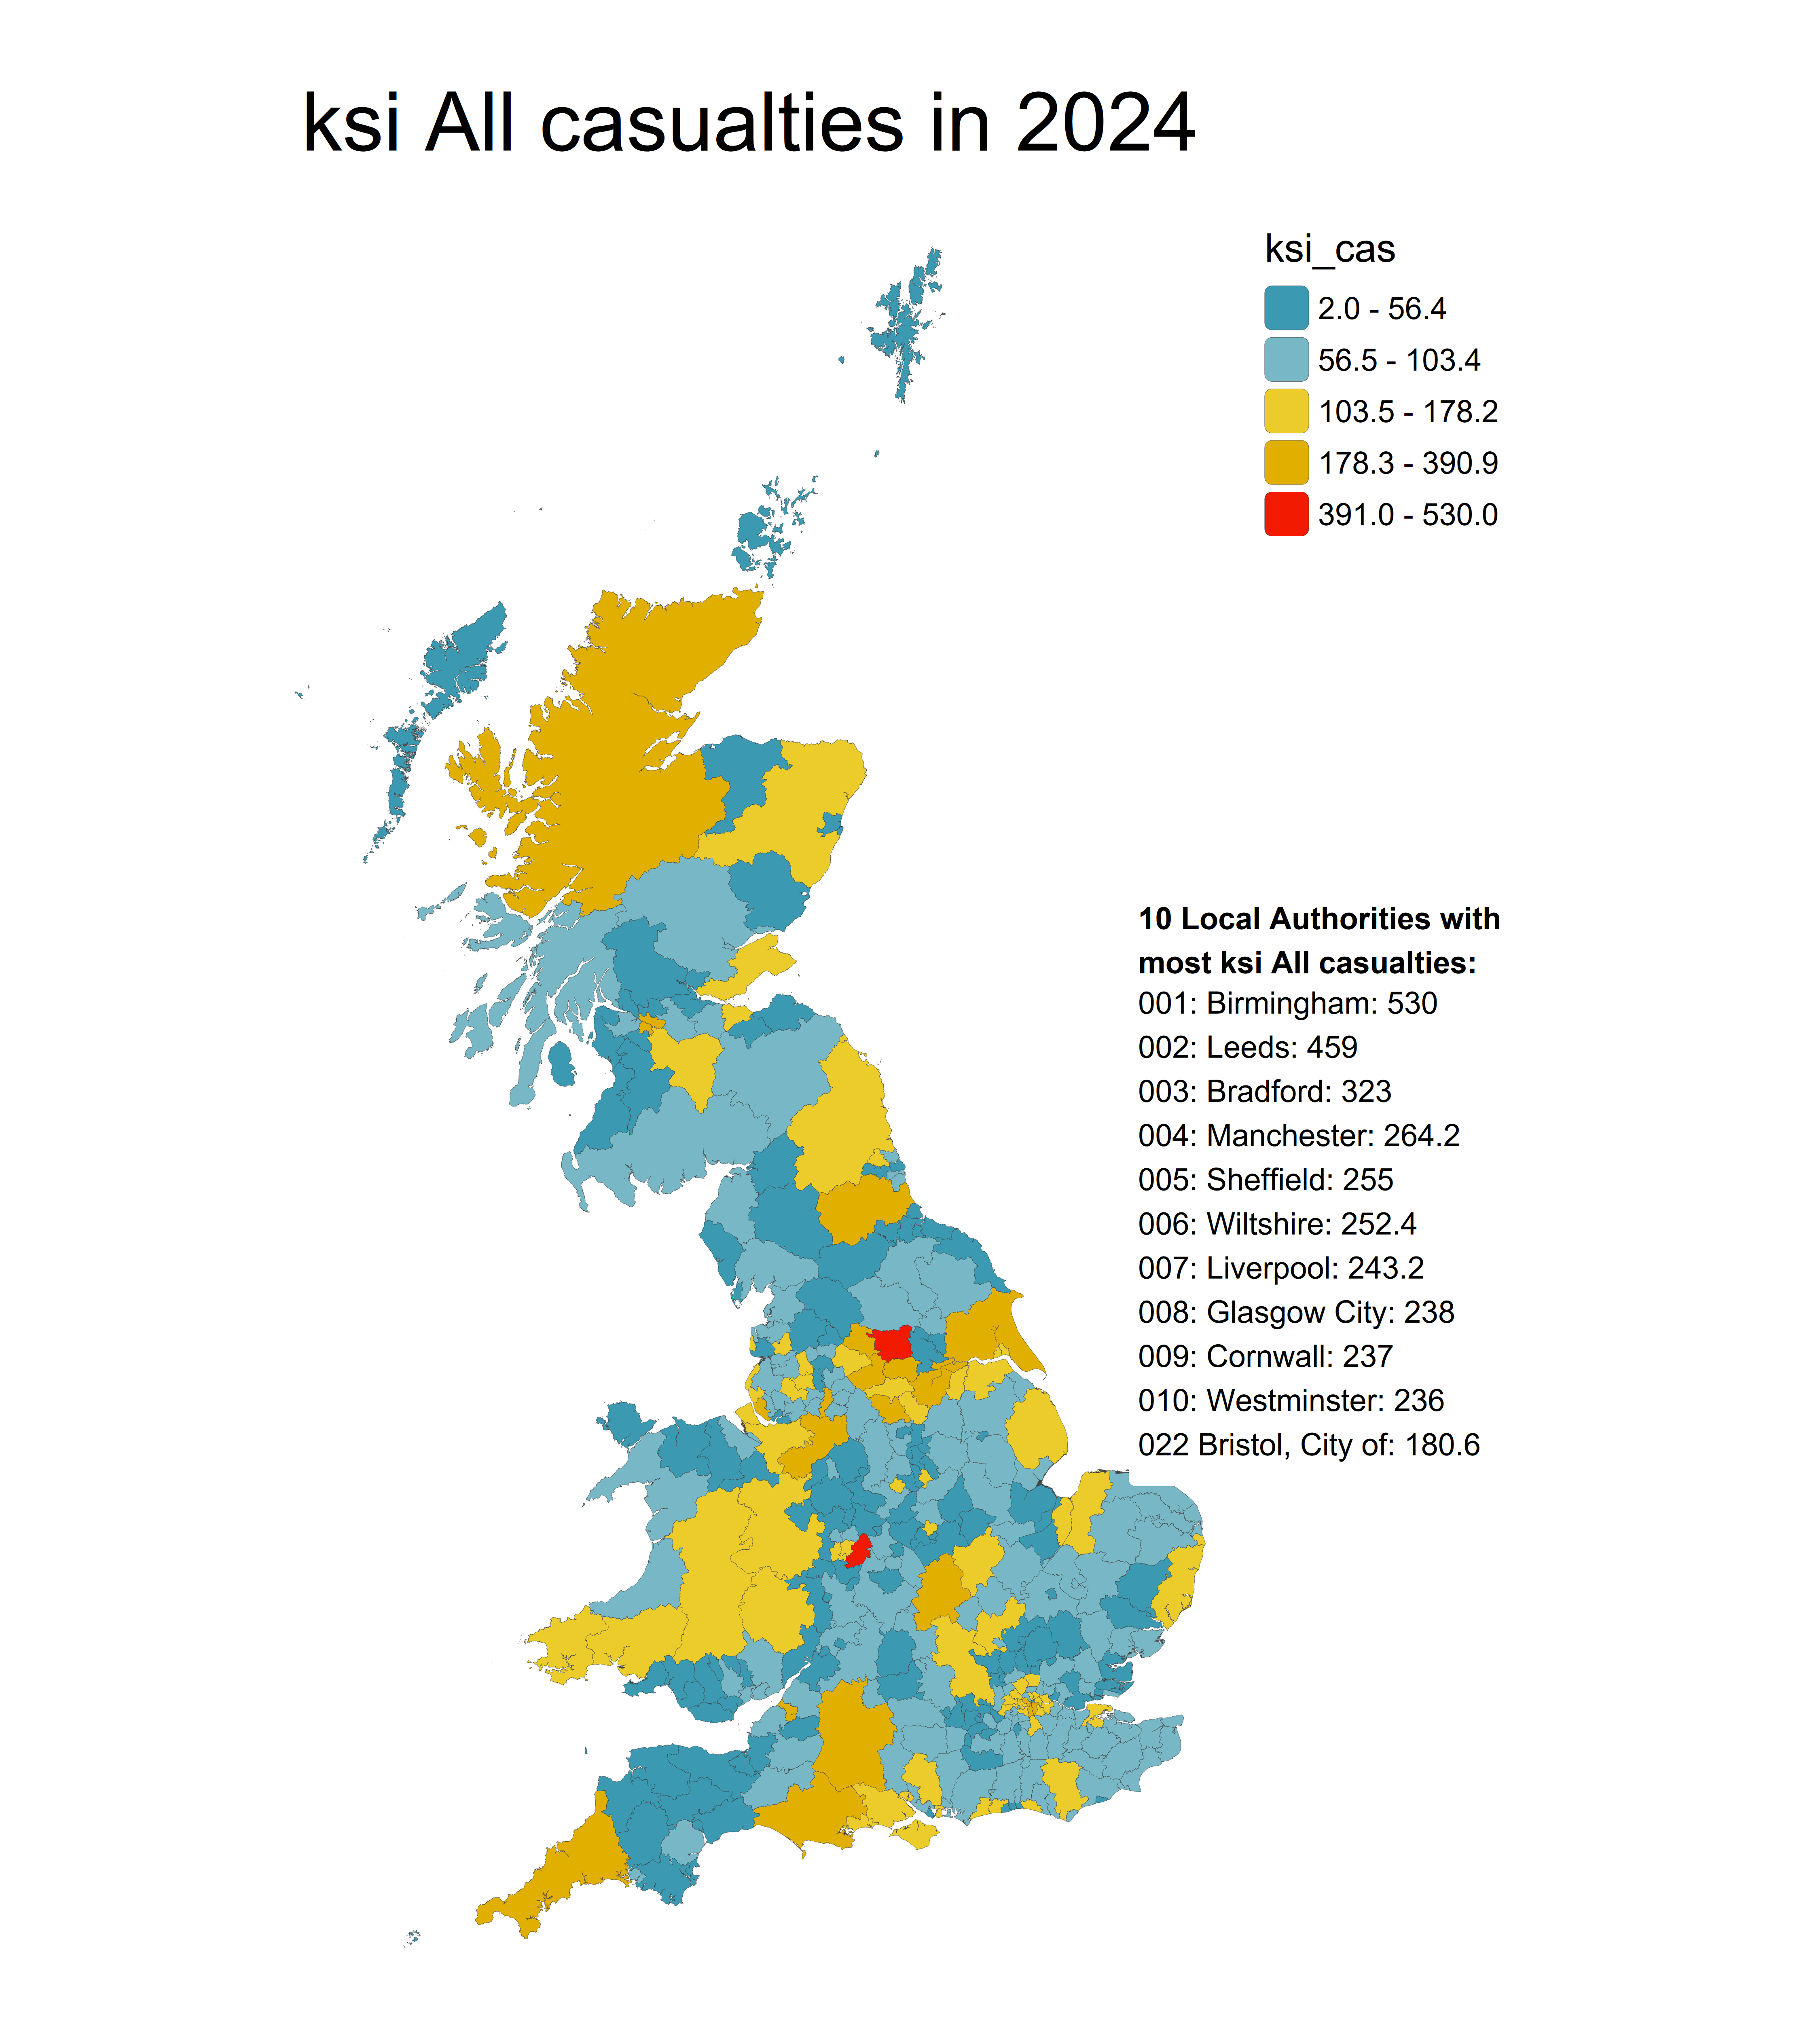
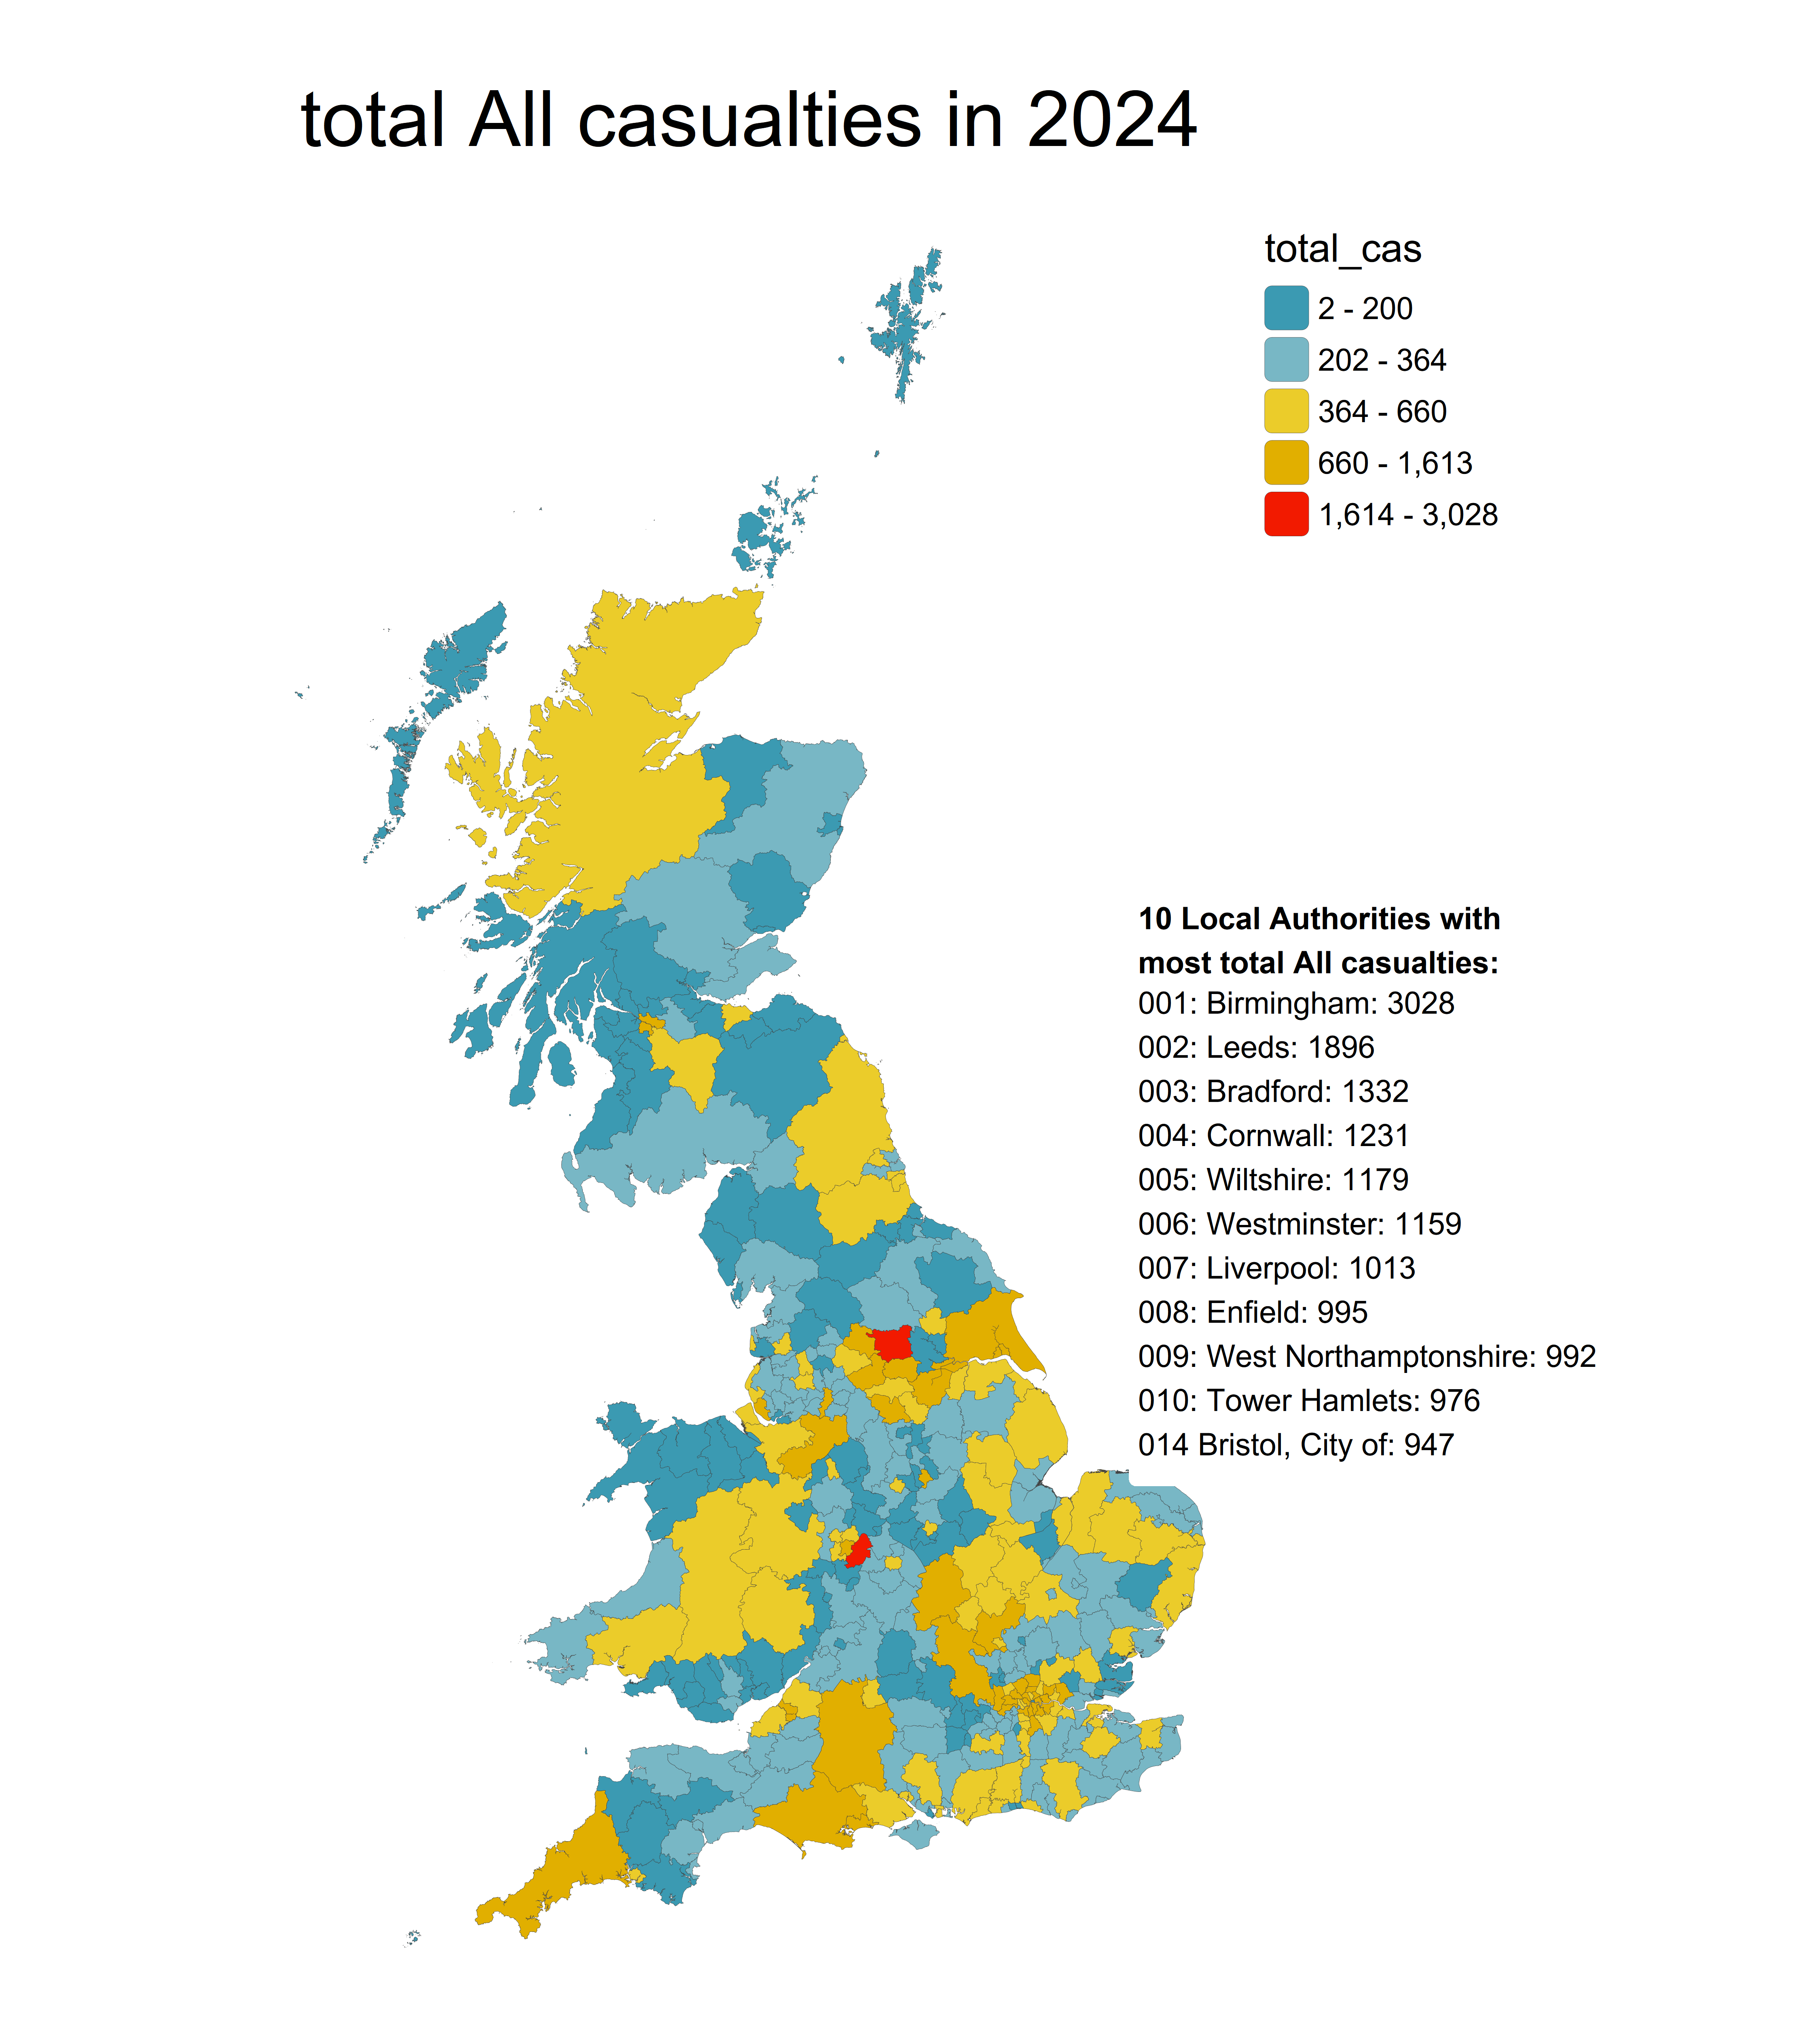
In 2024, Bristol had 834 collisions involving all casualty types resulting in 947 casualties reported to the police. This is the 14th highest of 374 Local Authorities in Great Britain (158th per capita) and an increase in collisions of 32 and an increase in total casualties of 19. For fatal it ranked 70th ( 206th per capita) with 7 casualties down on 2023. For KSIs it ranked 22nd (207th per capita) with 181 casualties up on 2023. For serious injuries it ranked 21st (204th per 1000) with 174 casualties up on 2023. For slight injuries it ranked 13th (136th per 1000) with 766 casualties down on 2023.
Compared to 5 years ago collisions are up by 190, total casualties up by 180, fatalities down by 0, KSI casualties up by 87, serious injuries up by 87 and slight injuries up by 93.
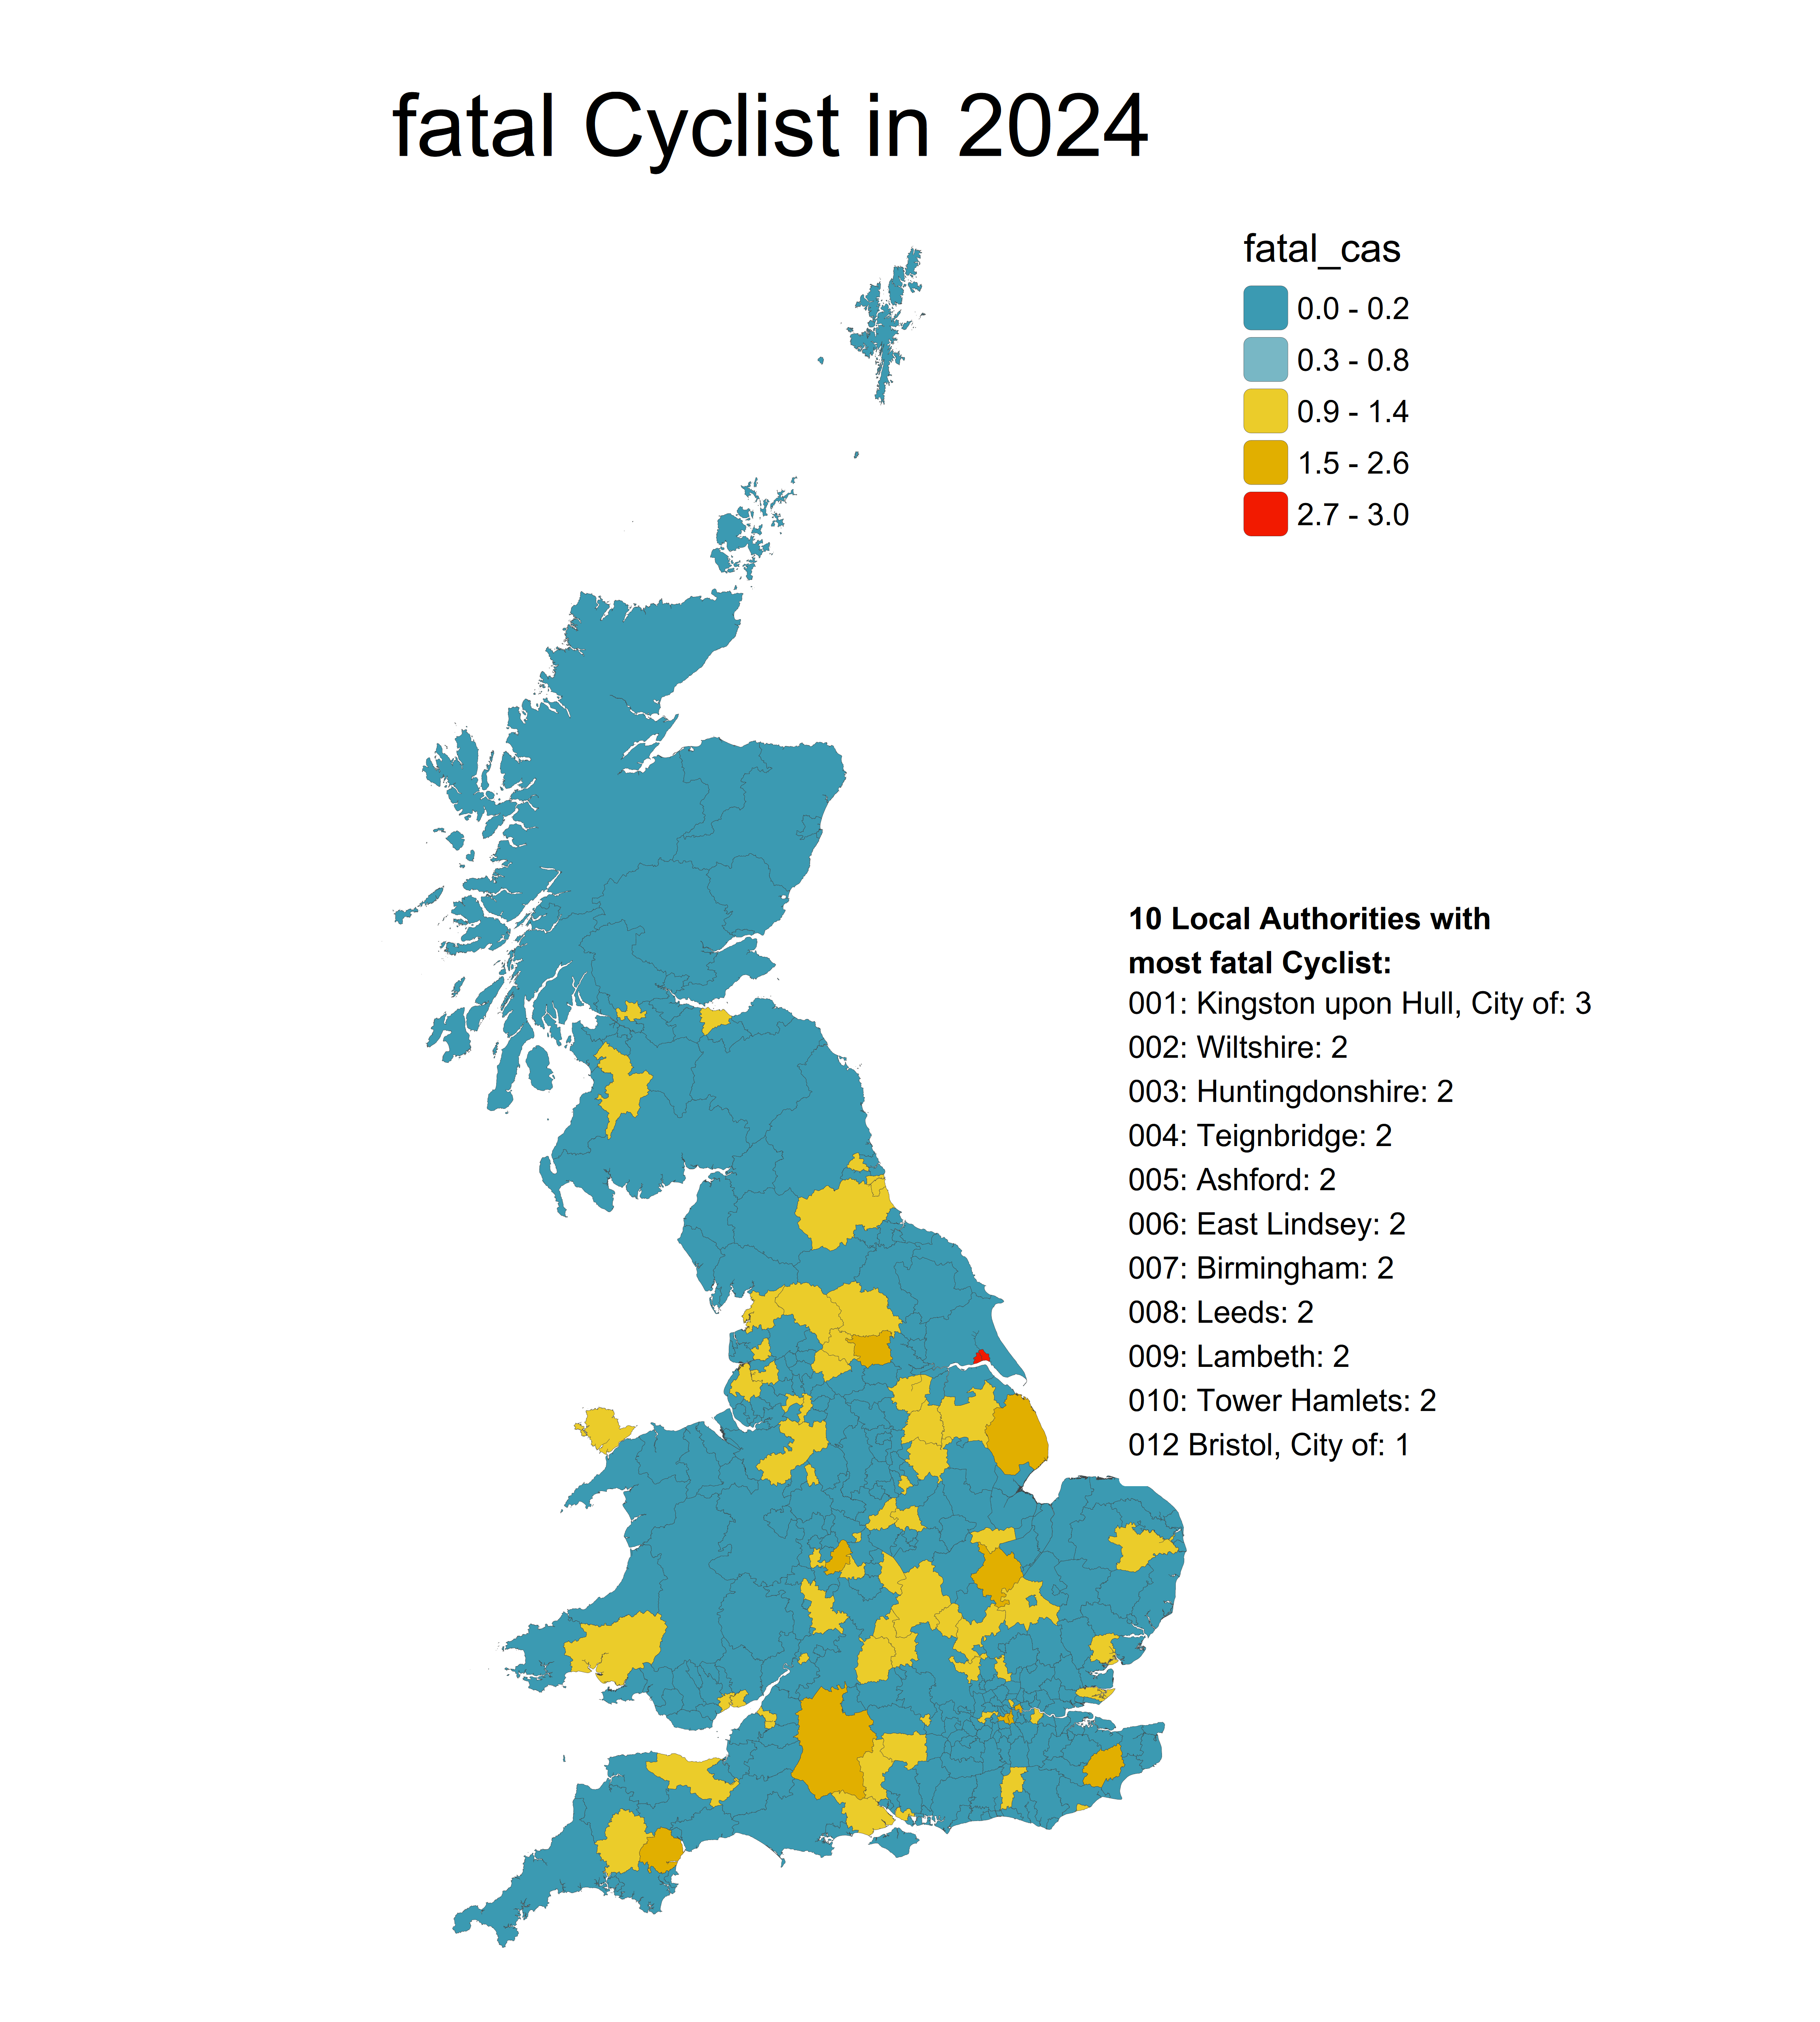
For cyclists there were 231 collisions resulting in 235 cyclist casualties reported to the police. This is the 8th highest of 374 Local Authorities in Great Britain (21st per capita) and an increase in collisions of 29 and an increase in total casualties. For fatal it ranked 41st (60th per capita) with 1 cyclist casualties up on 2023. For KSIs it ranked 17th ( 71st per capita) with 38 casualties up on 2023. For serious injuries it ranked 19th (73rd per 1000) with 37 cyclist casualties up on 2023. For slight injuries it ranked 7th (18th per 1000) with 197 cyclist casualties up on 2023.
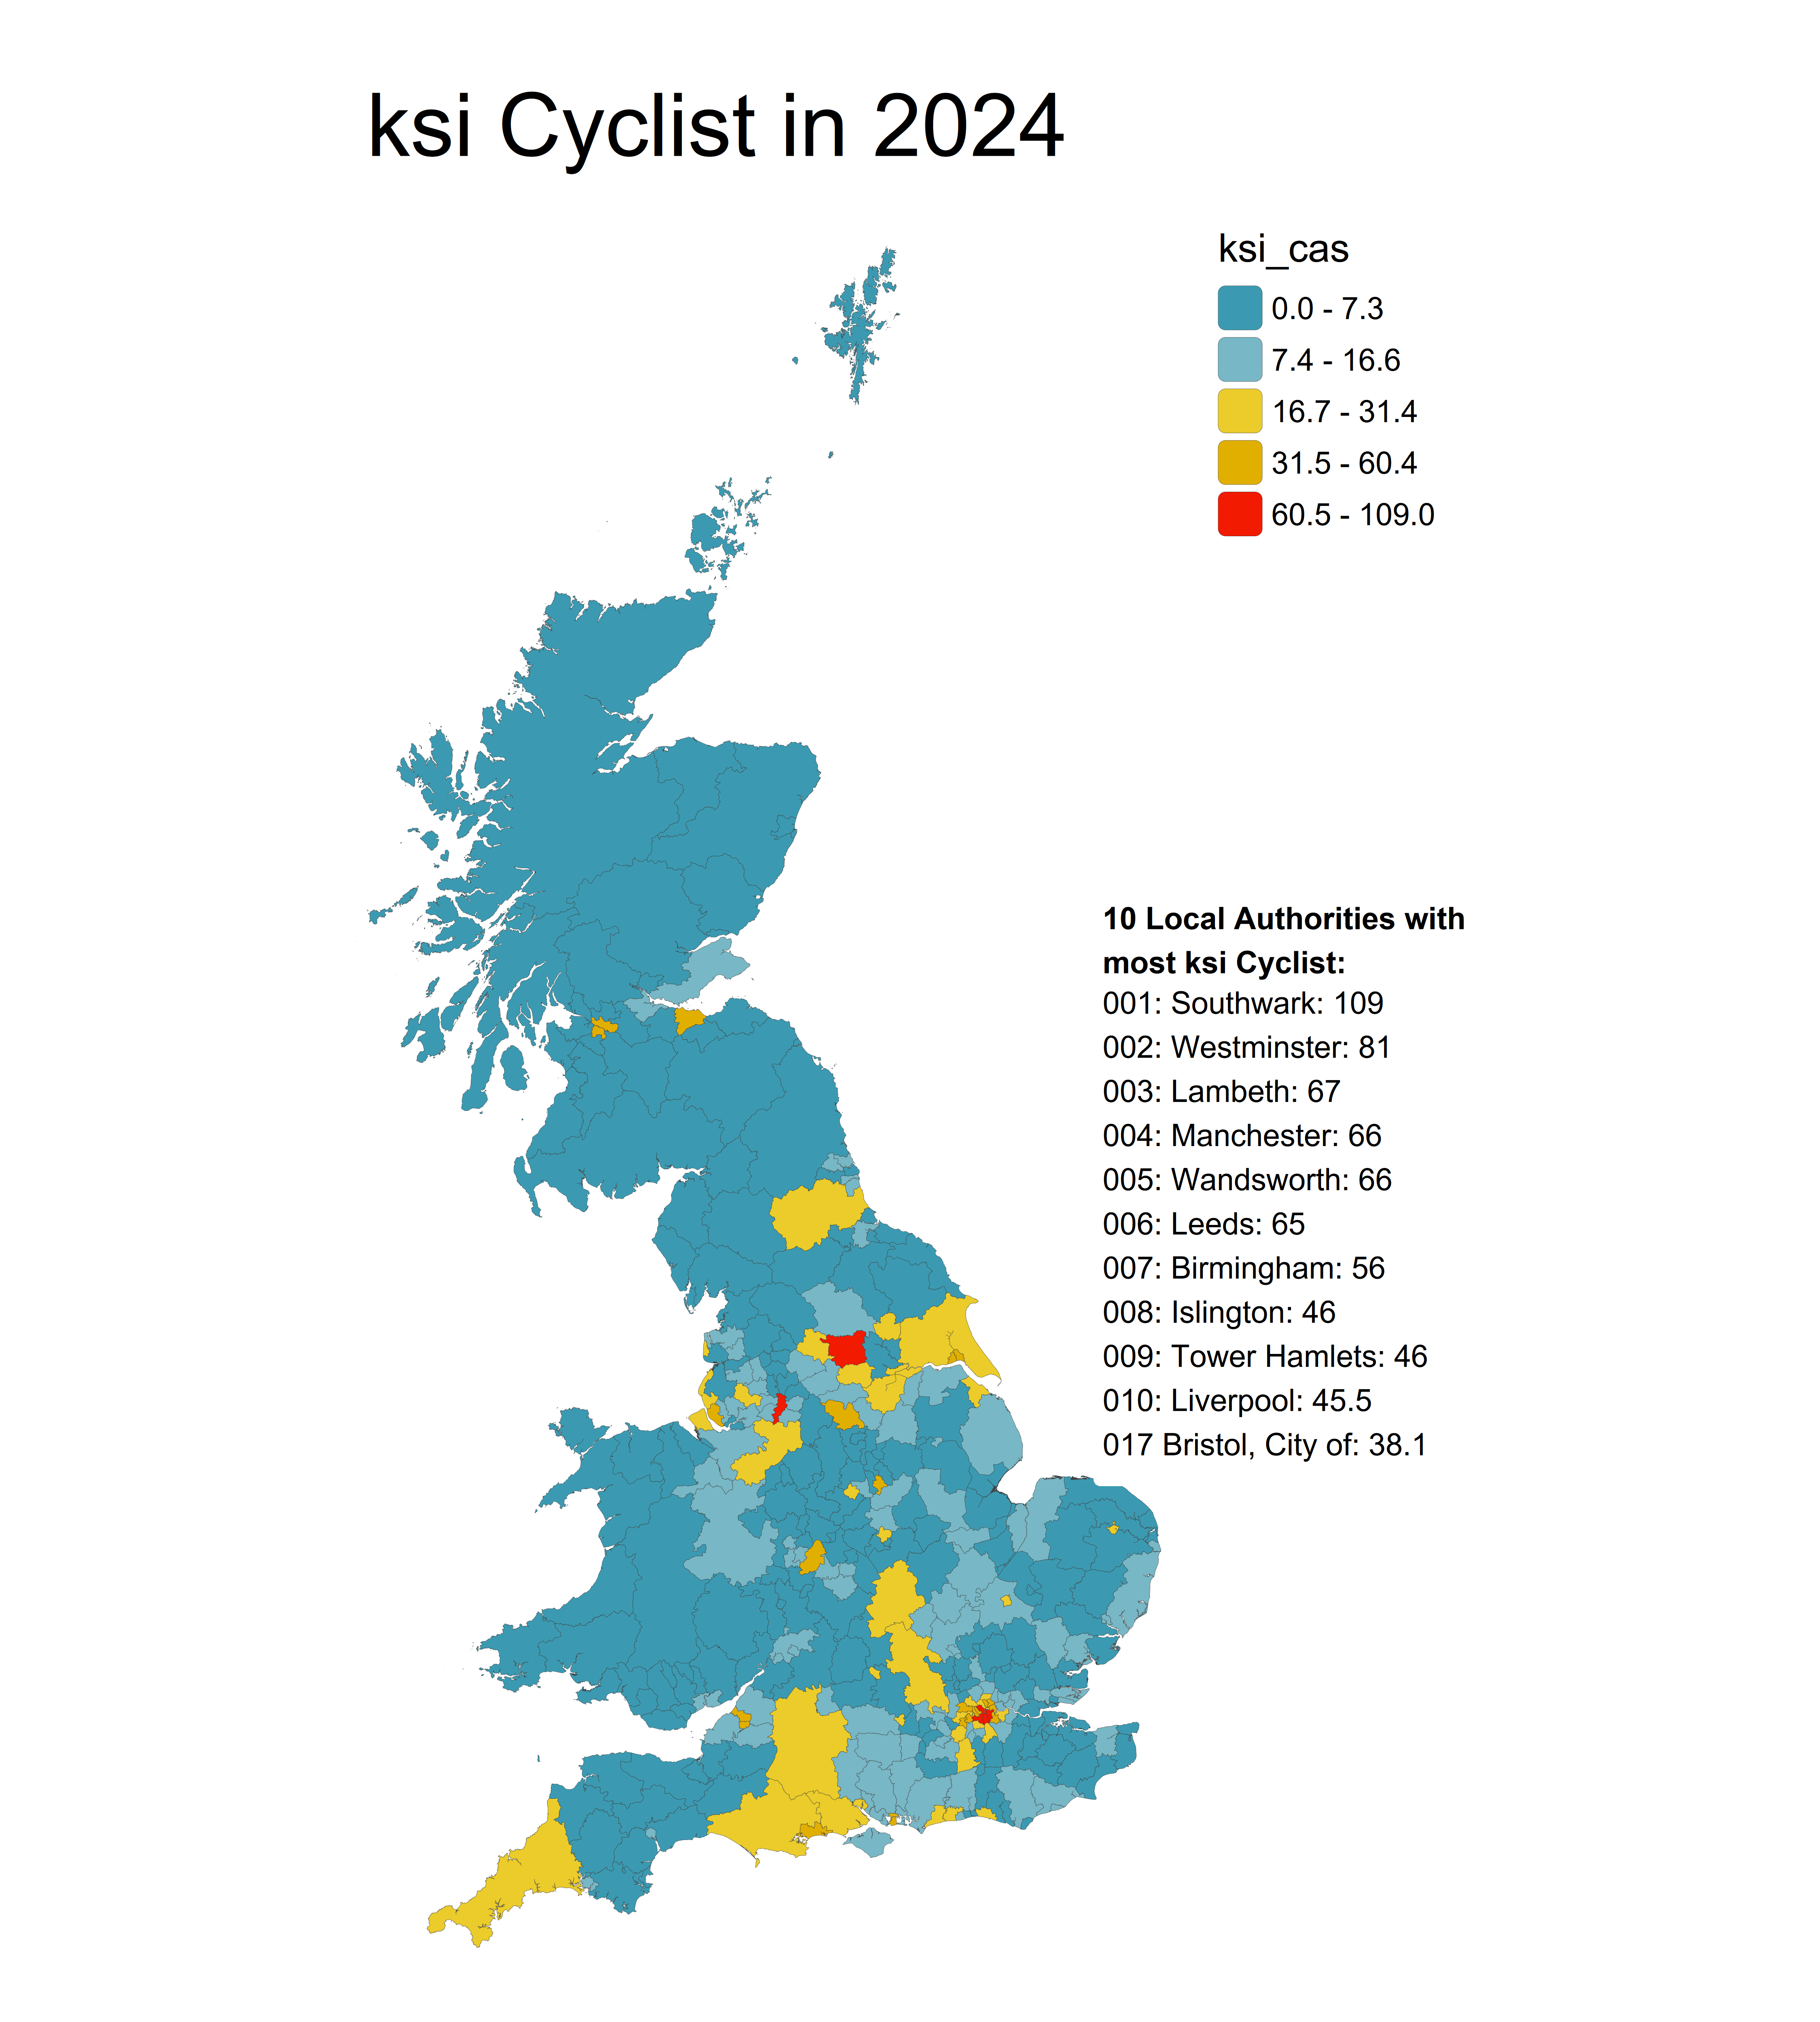
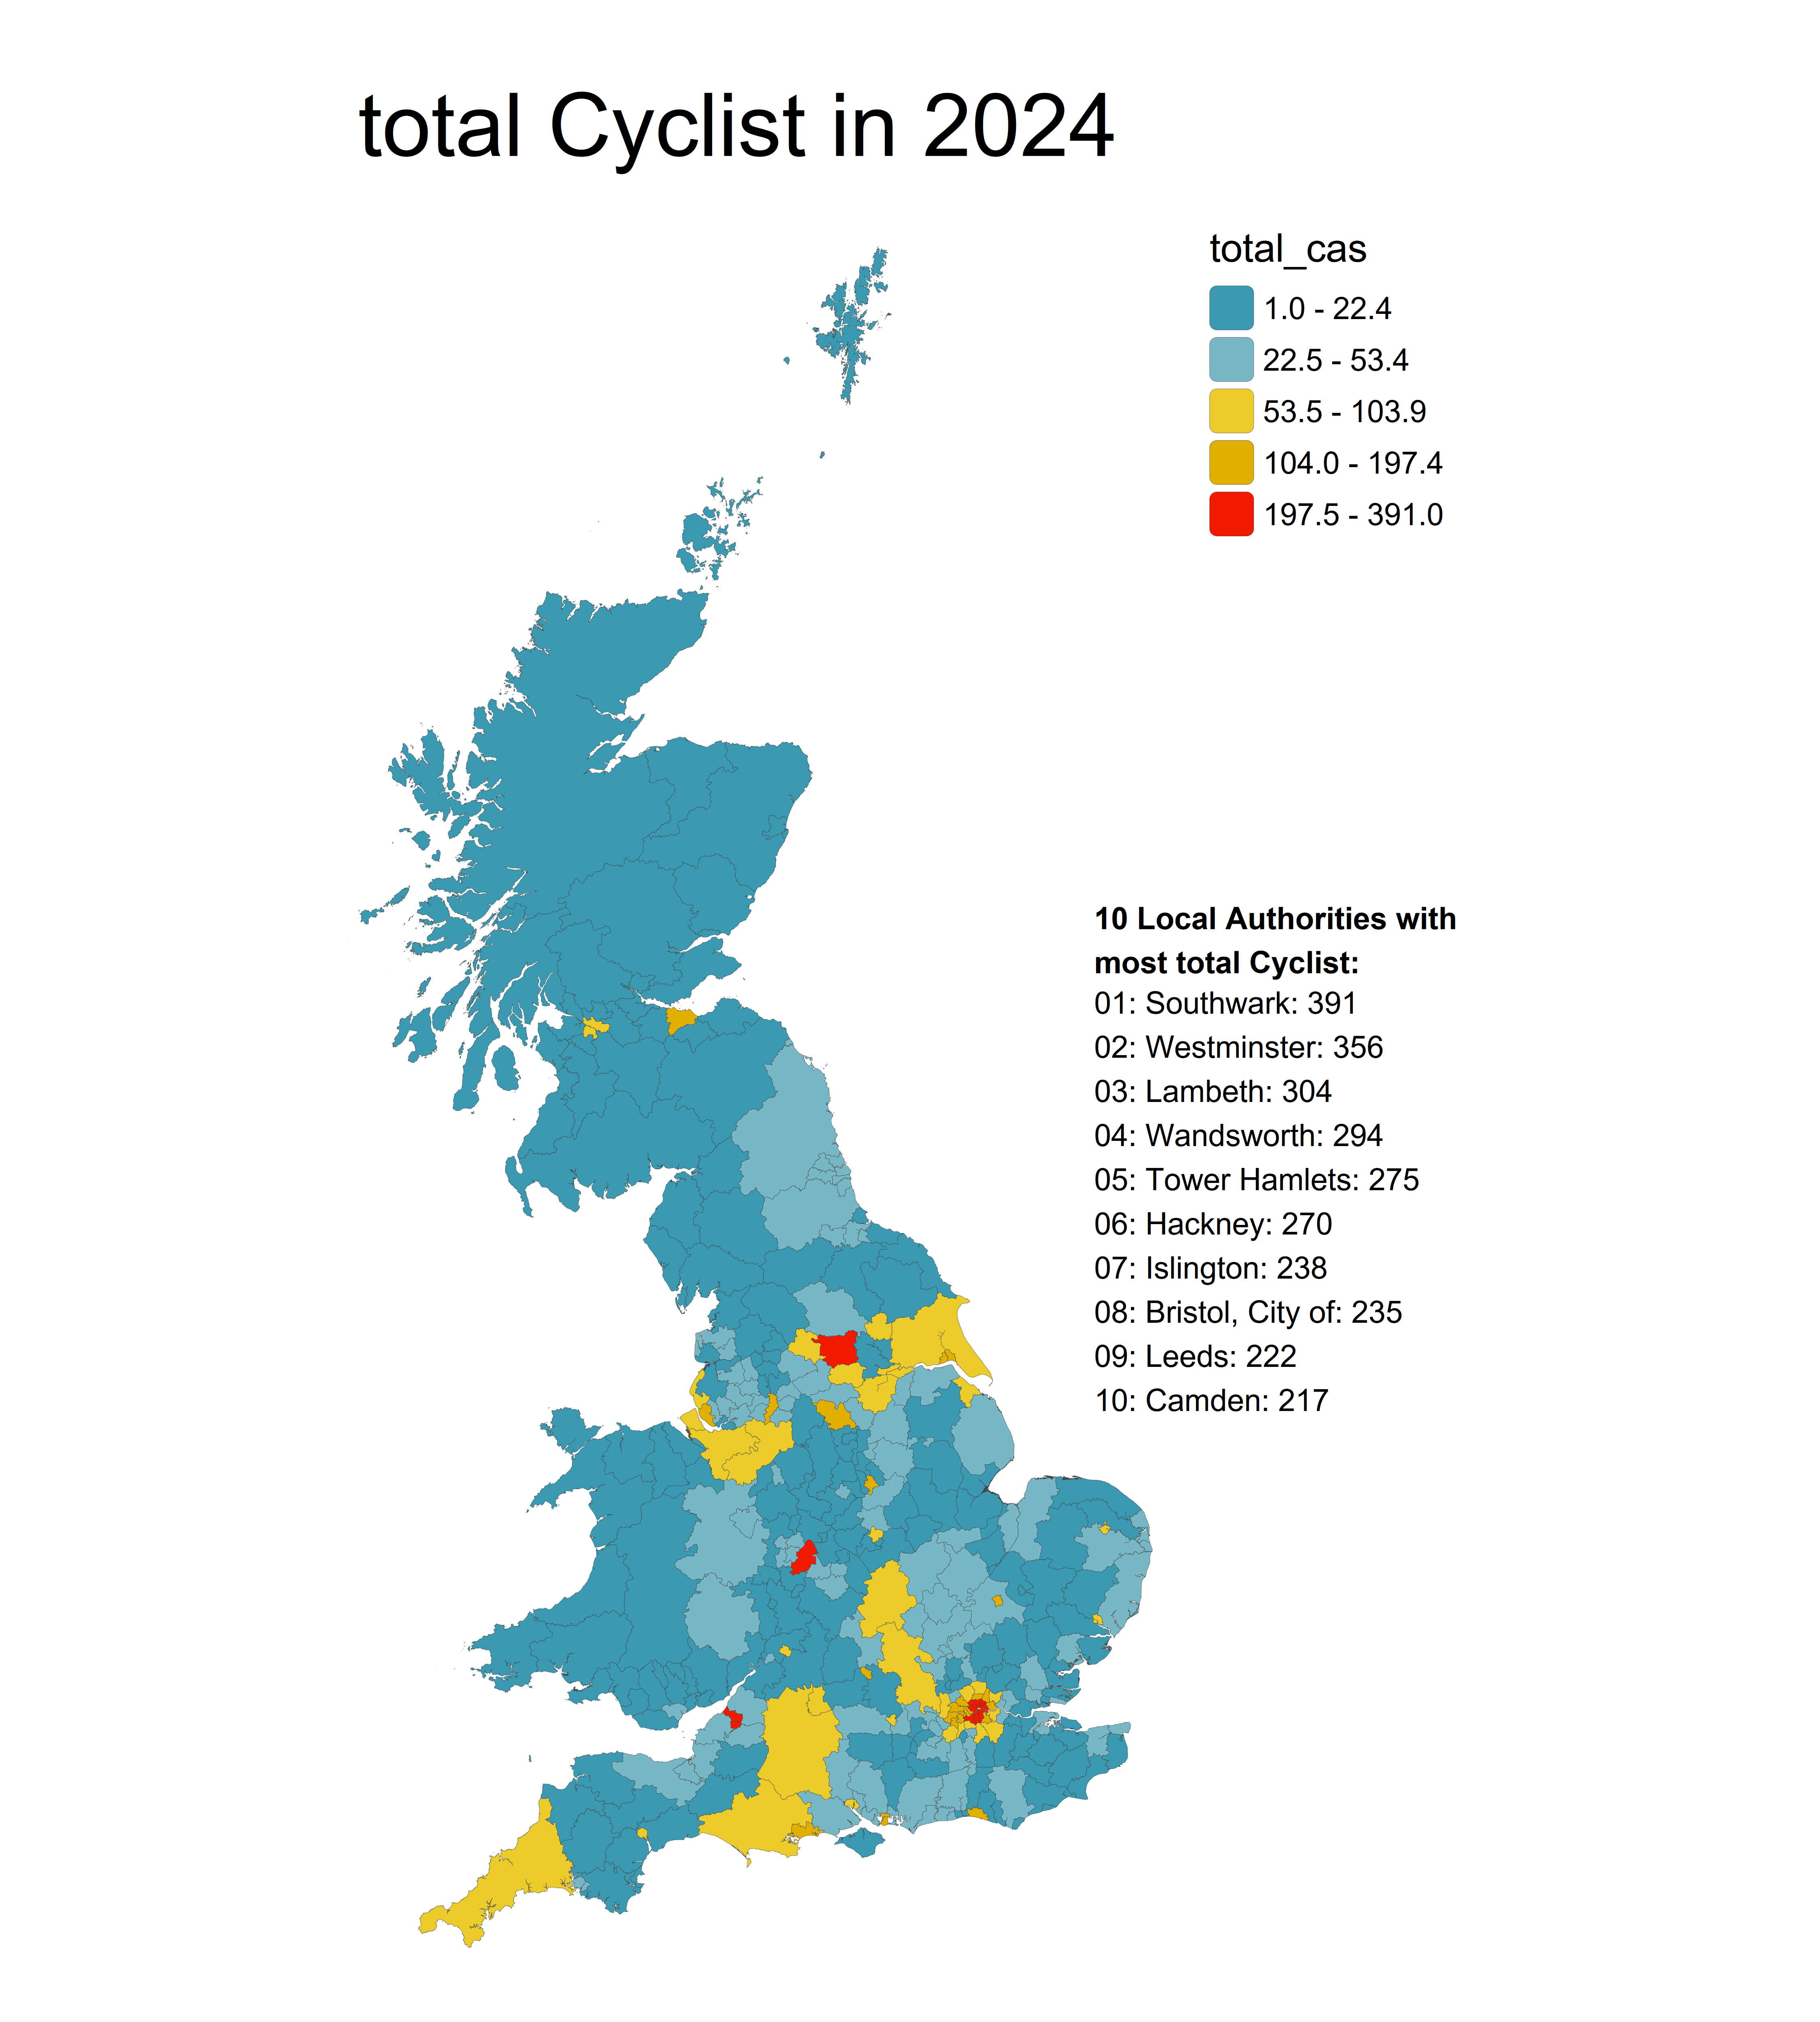
Compared to 5 years ago collisions involving cyclists are up by 60, total casualties up by 63, fatalities up by 1, KSI casualties up by 18, serious injuries up by 17 and slight injuries up by 45.
![]()
For pedestrians there were 166 collisions resulting in 174 pedestrian casualties reported to the police. This is the 14th highest of 374 Local Authorities in Great Britain (67th per capita) and an increase in collisions of 6 and an increase in total casualties. For fatal it ranked 80th (160th per capita) with 2 pedestrian casualties down on 2023. For KSIs it ranked 13th (98th per capita) with 52 casualties down on 2023. For serious injuries it ranked 12th (90th per capita) with 50 pedestrian casualties down on 2023. For slight injuries it ranked 15th (64th per capita) with 122 pedestrian casualties up on 2023.
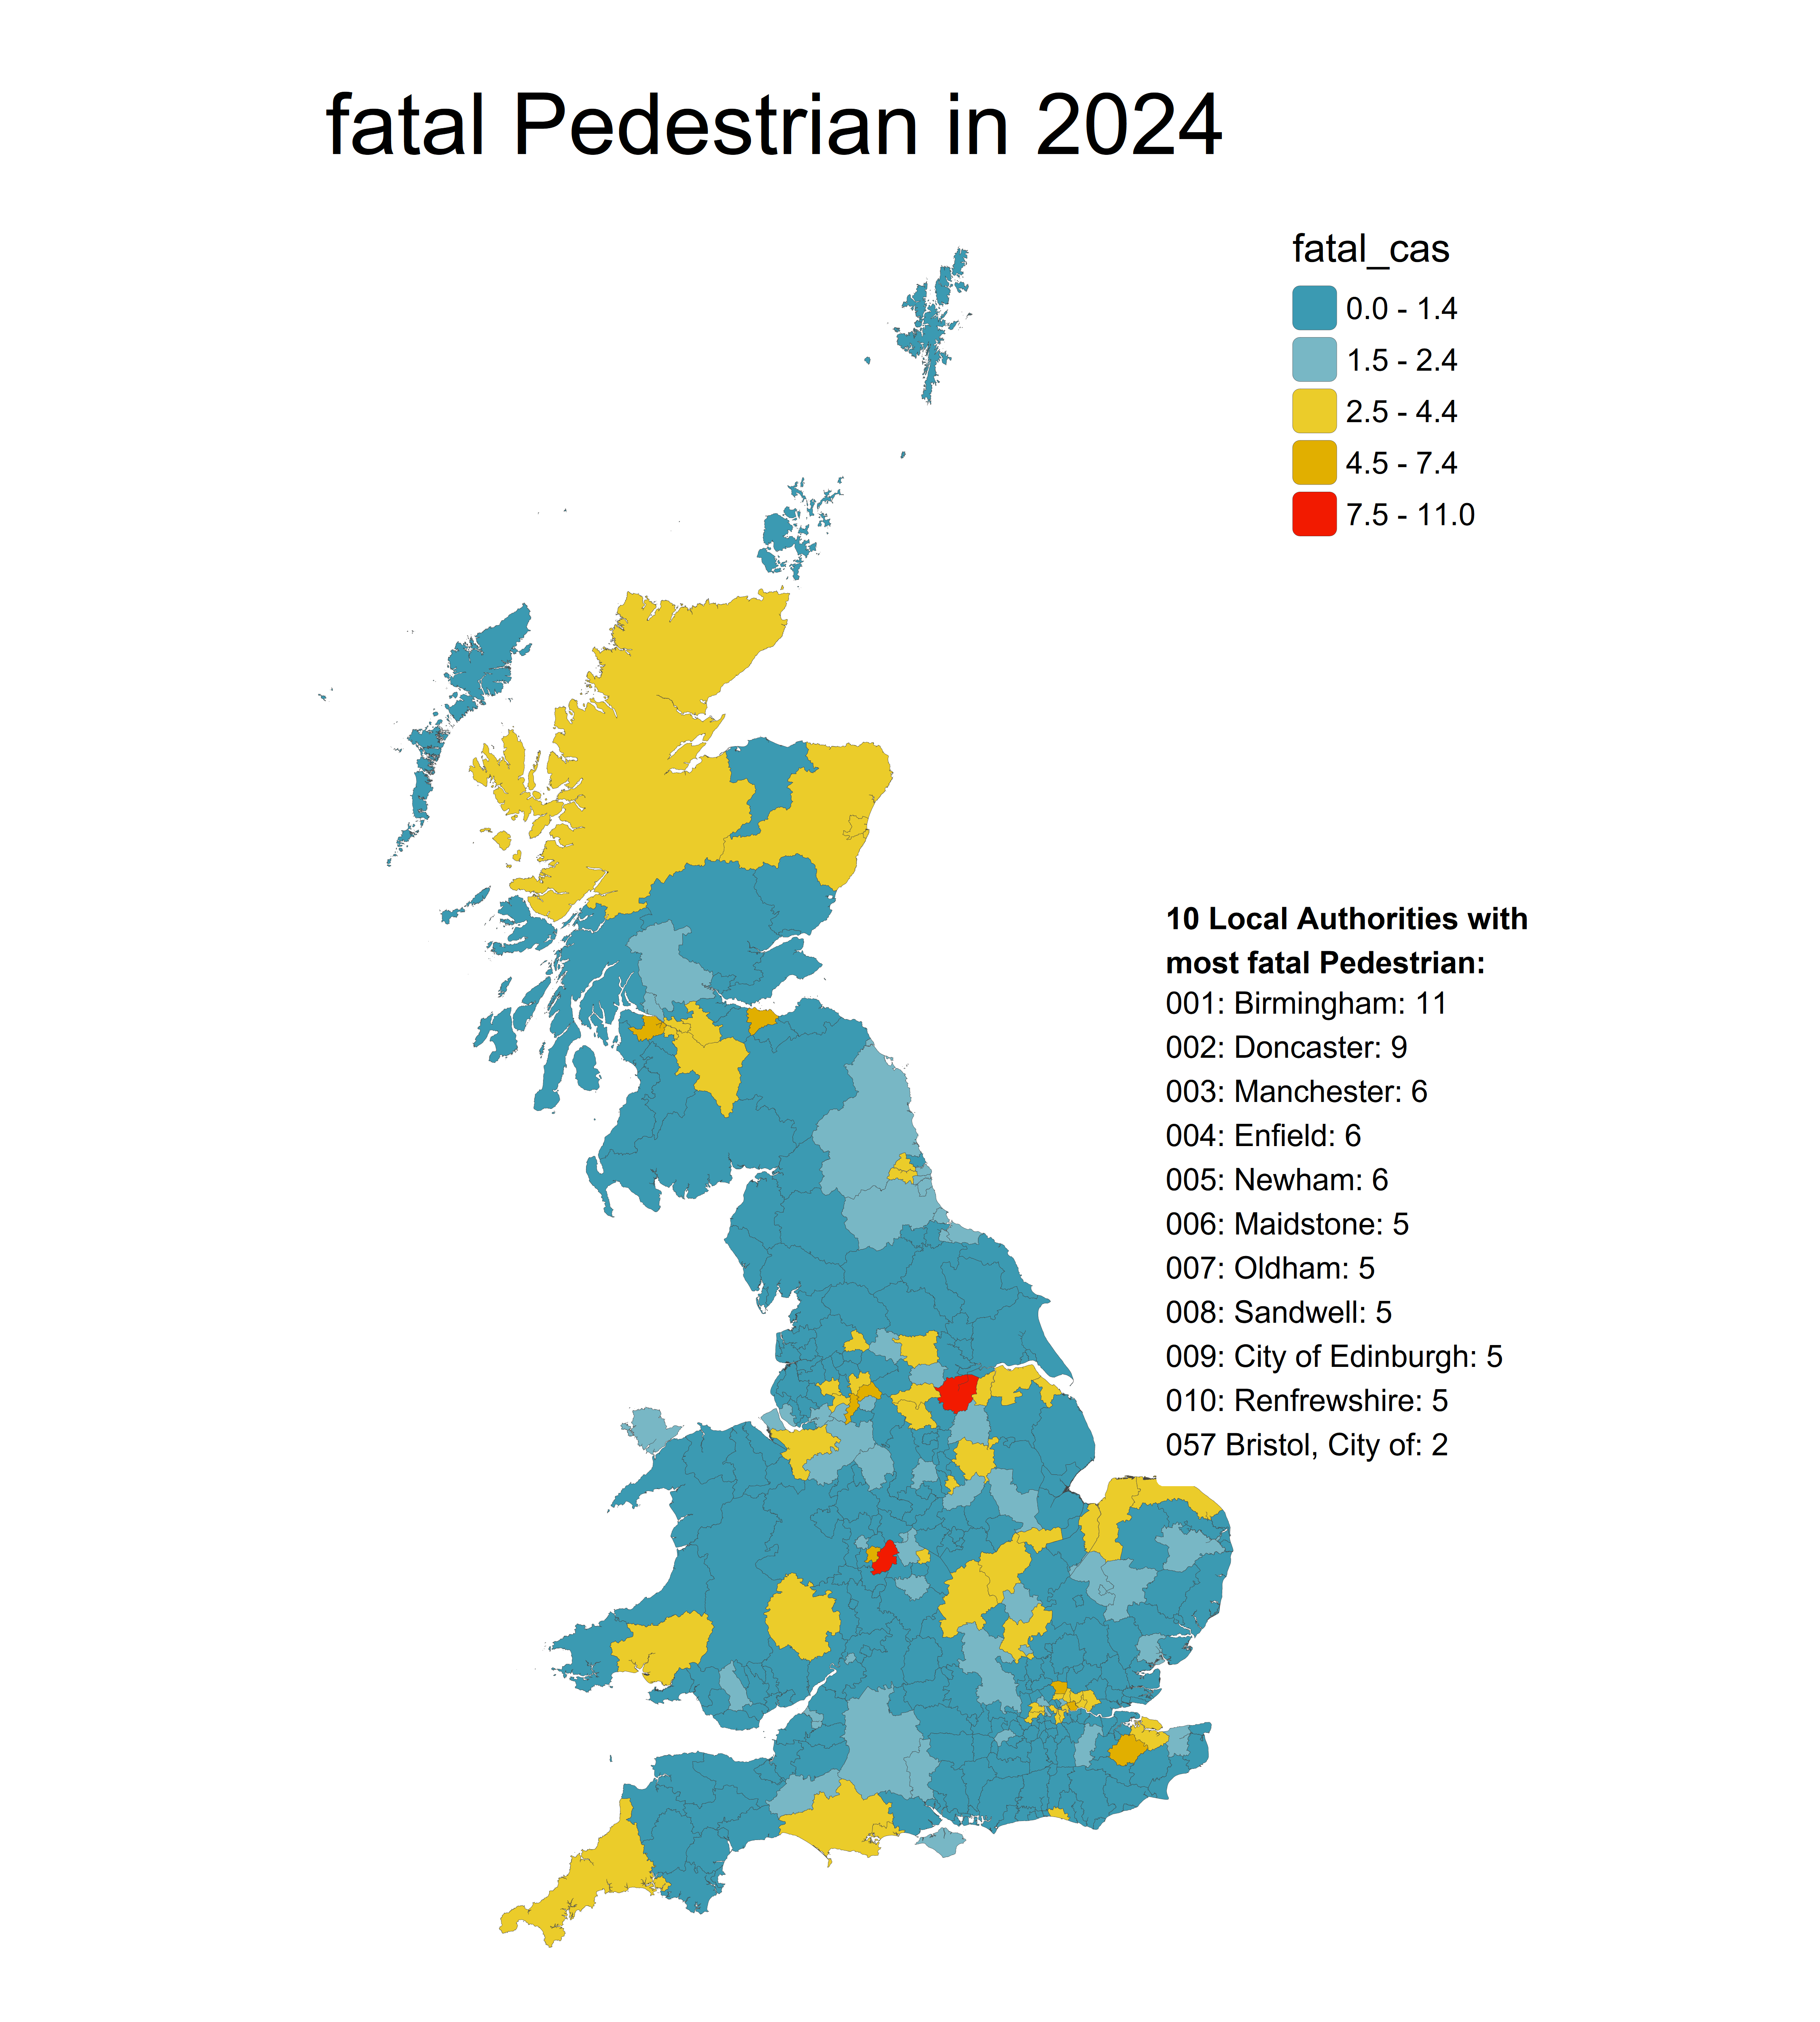
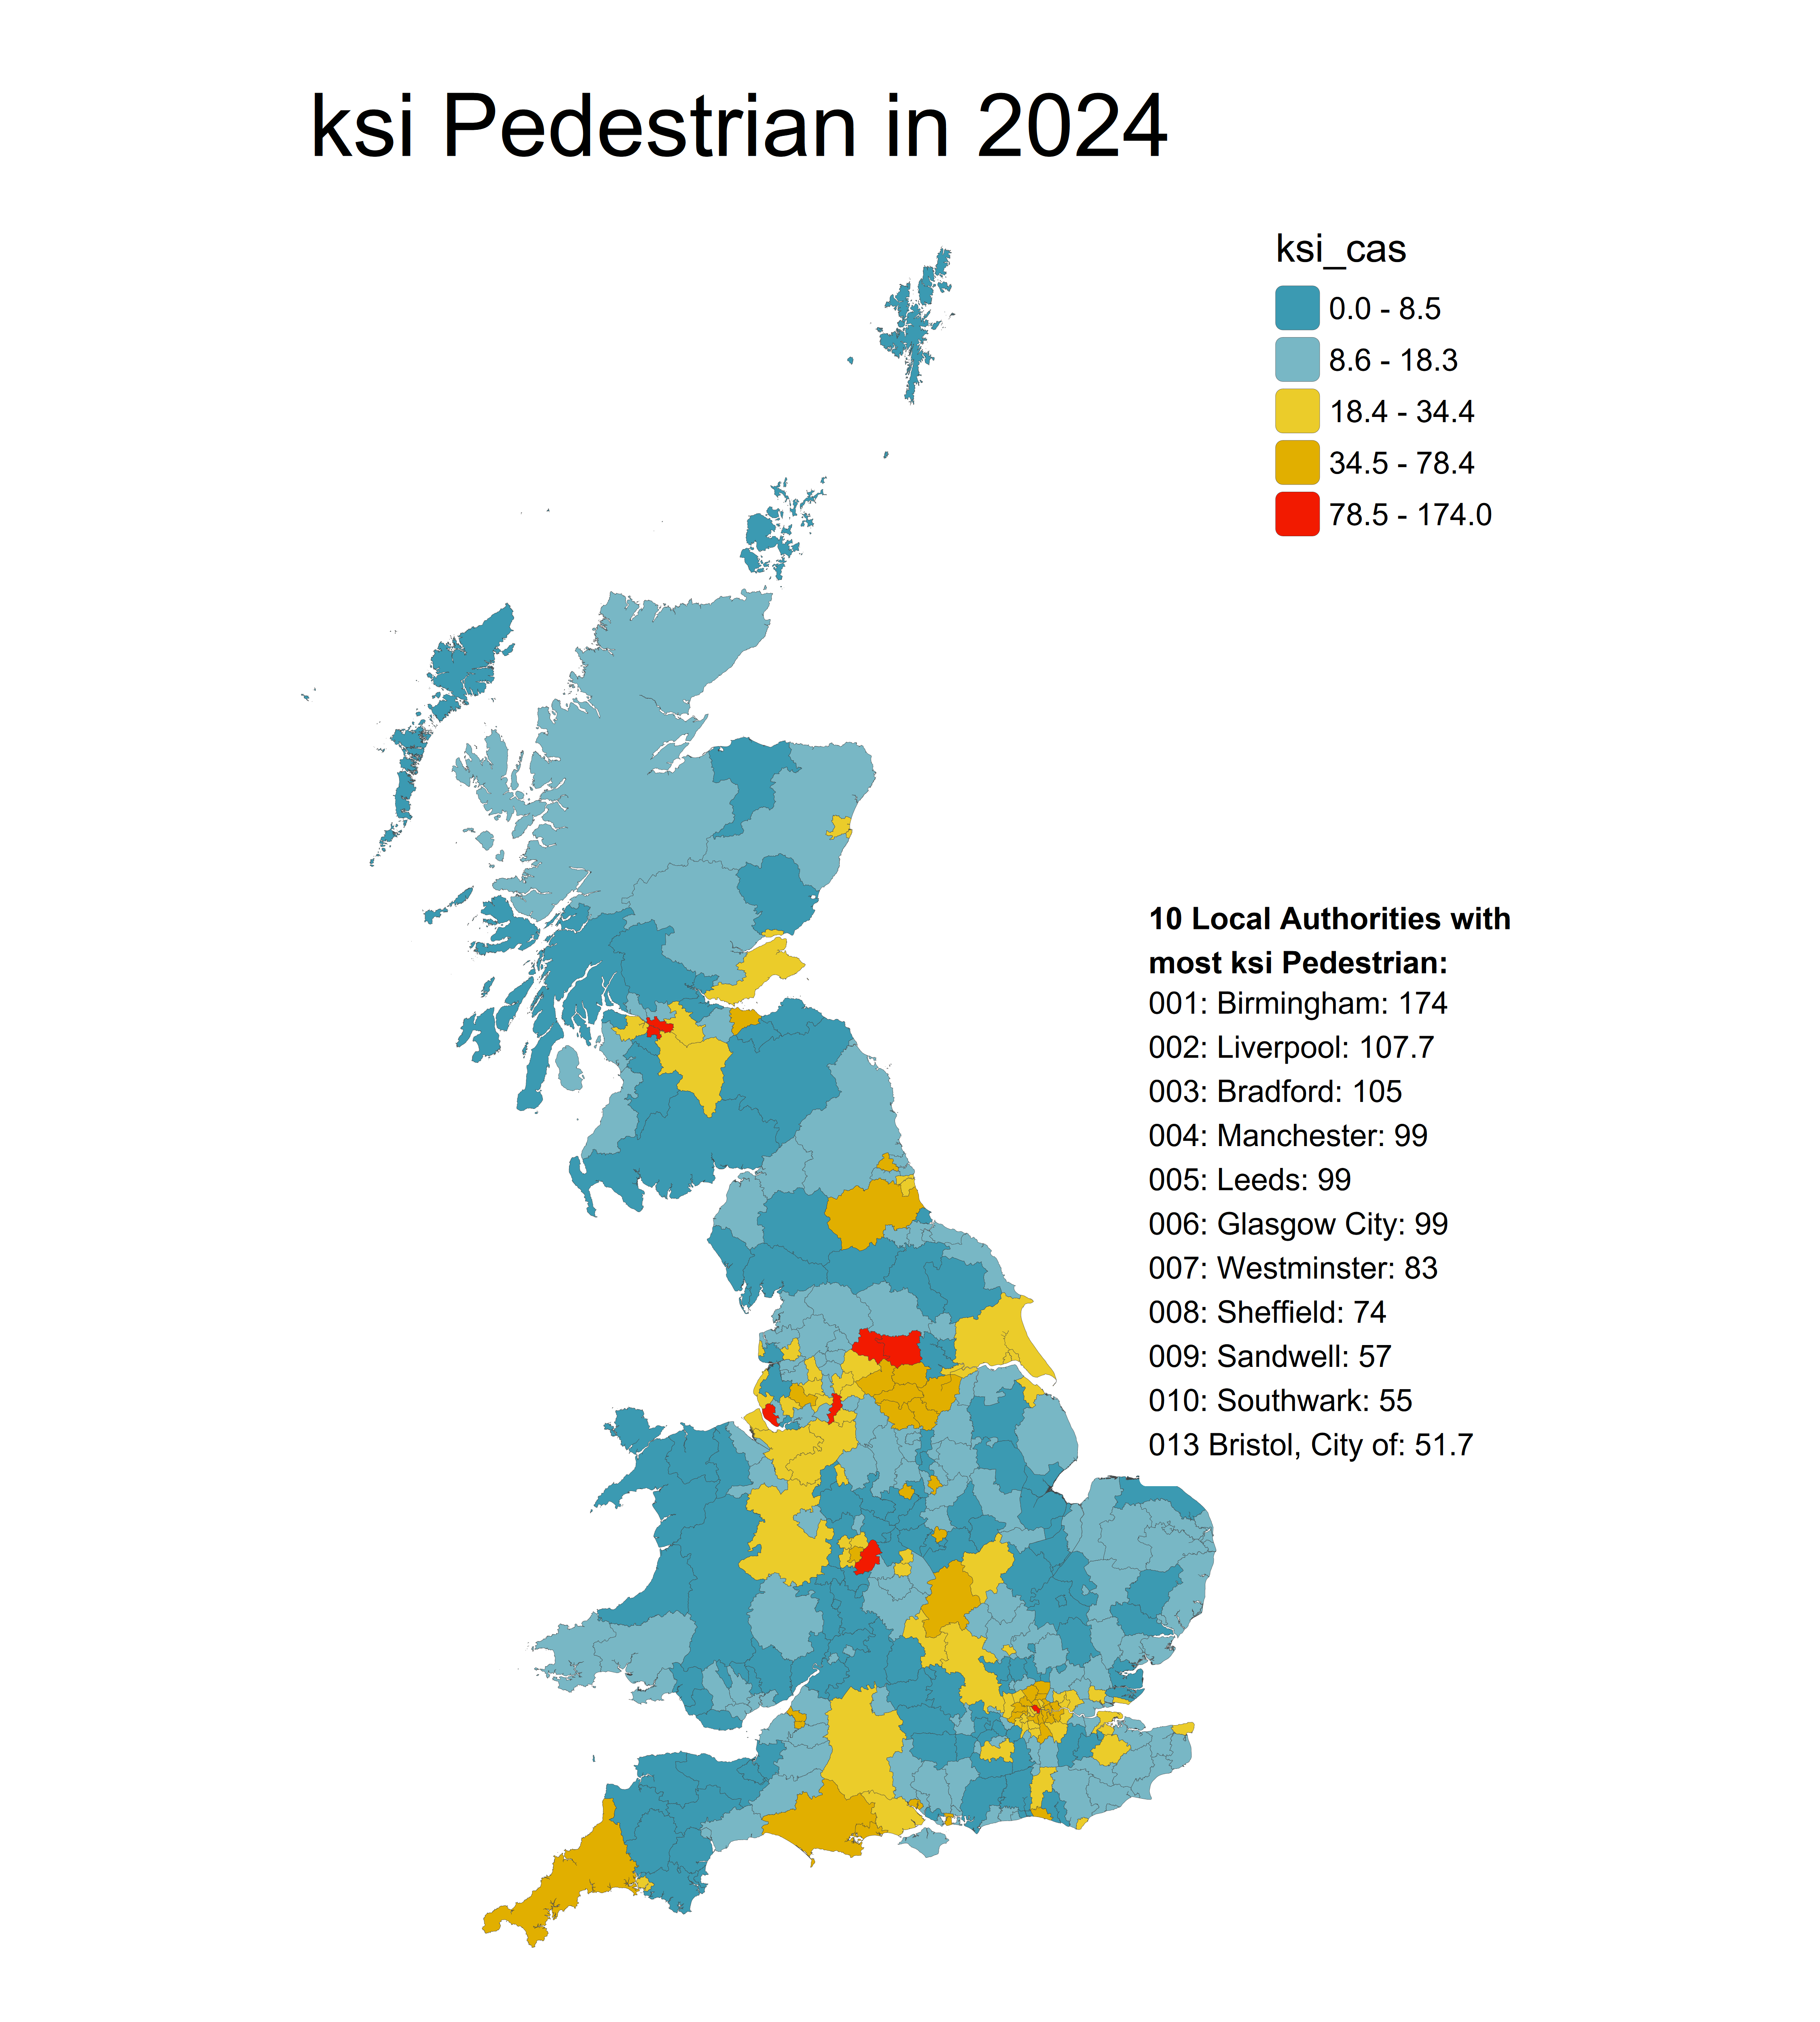
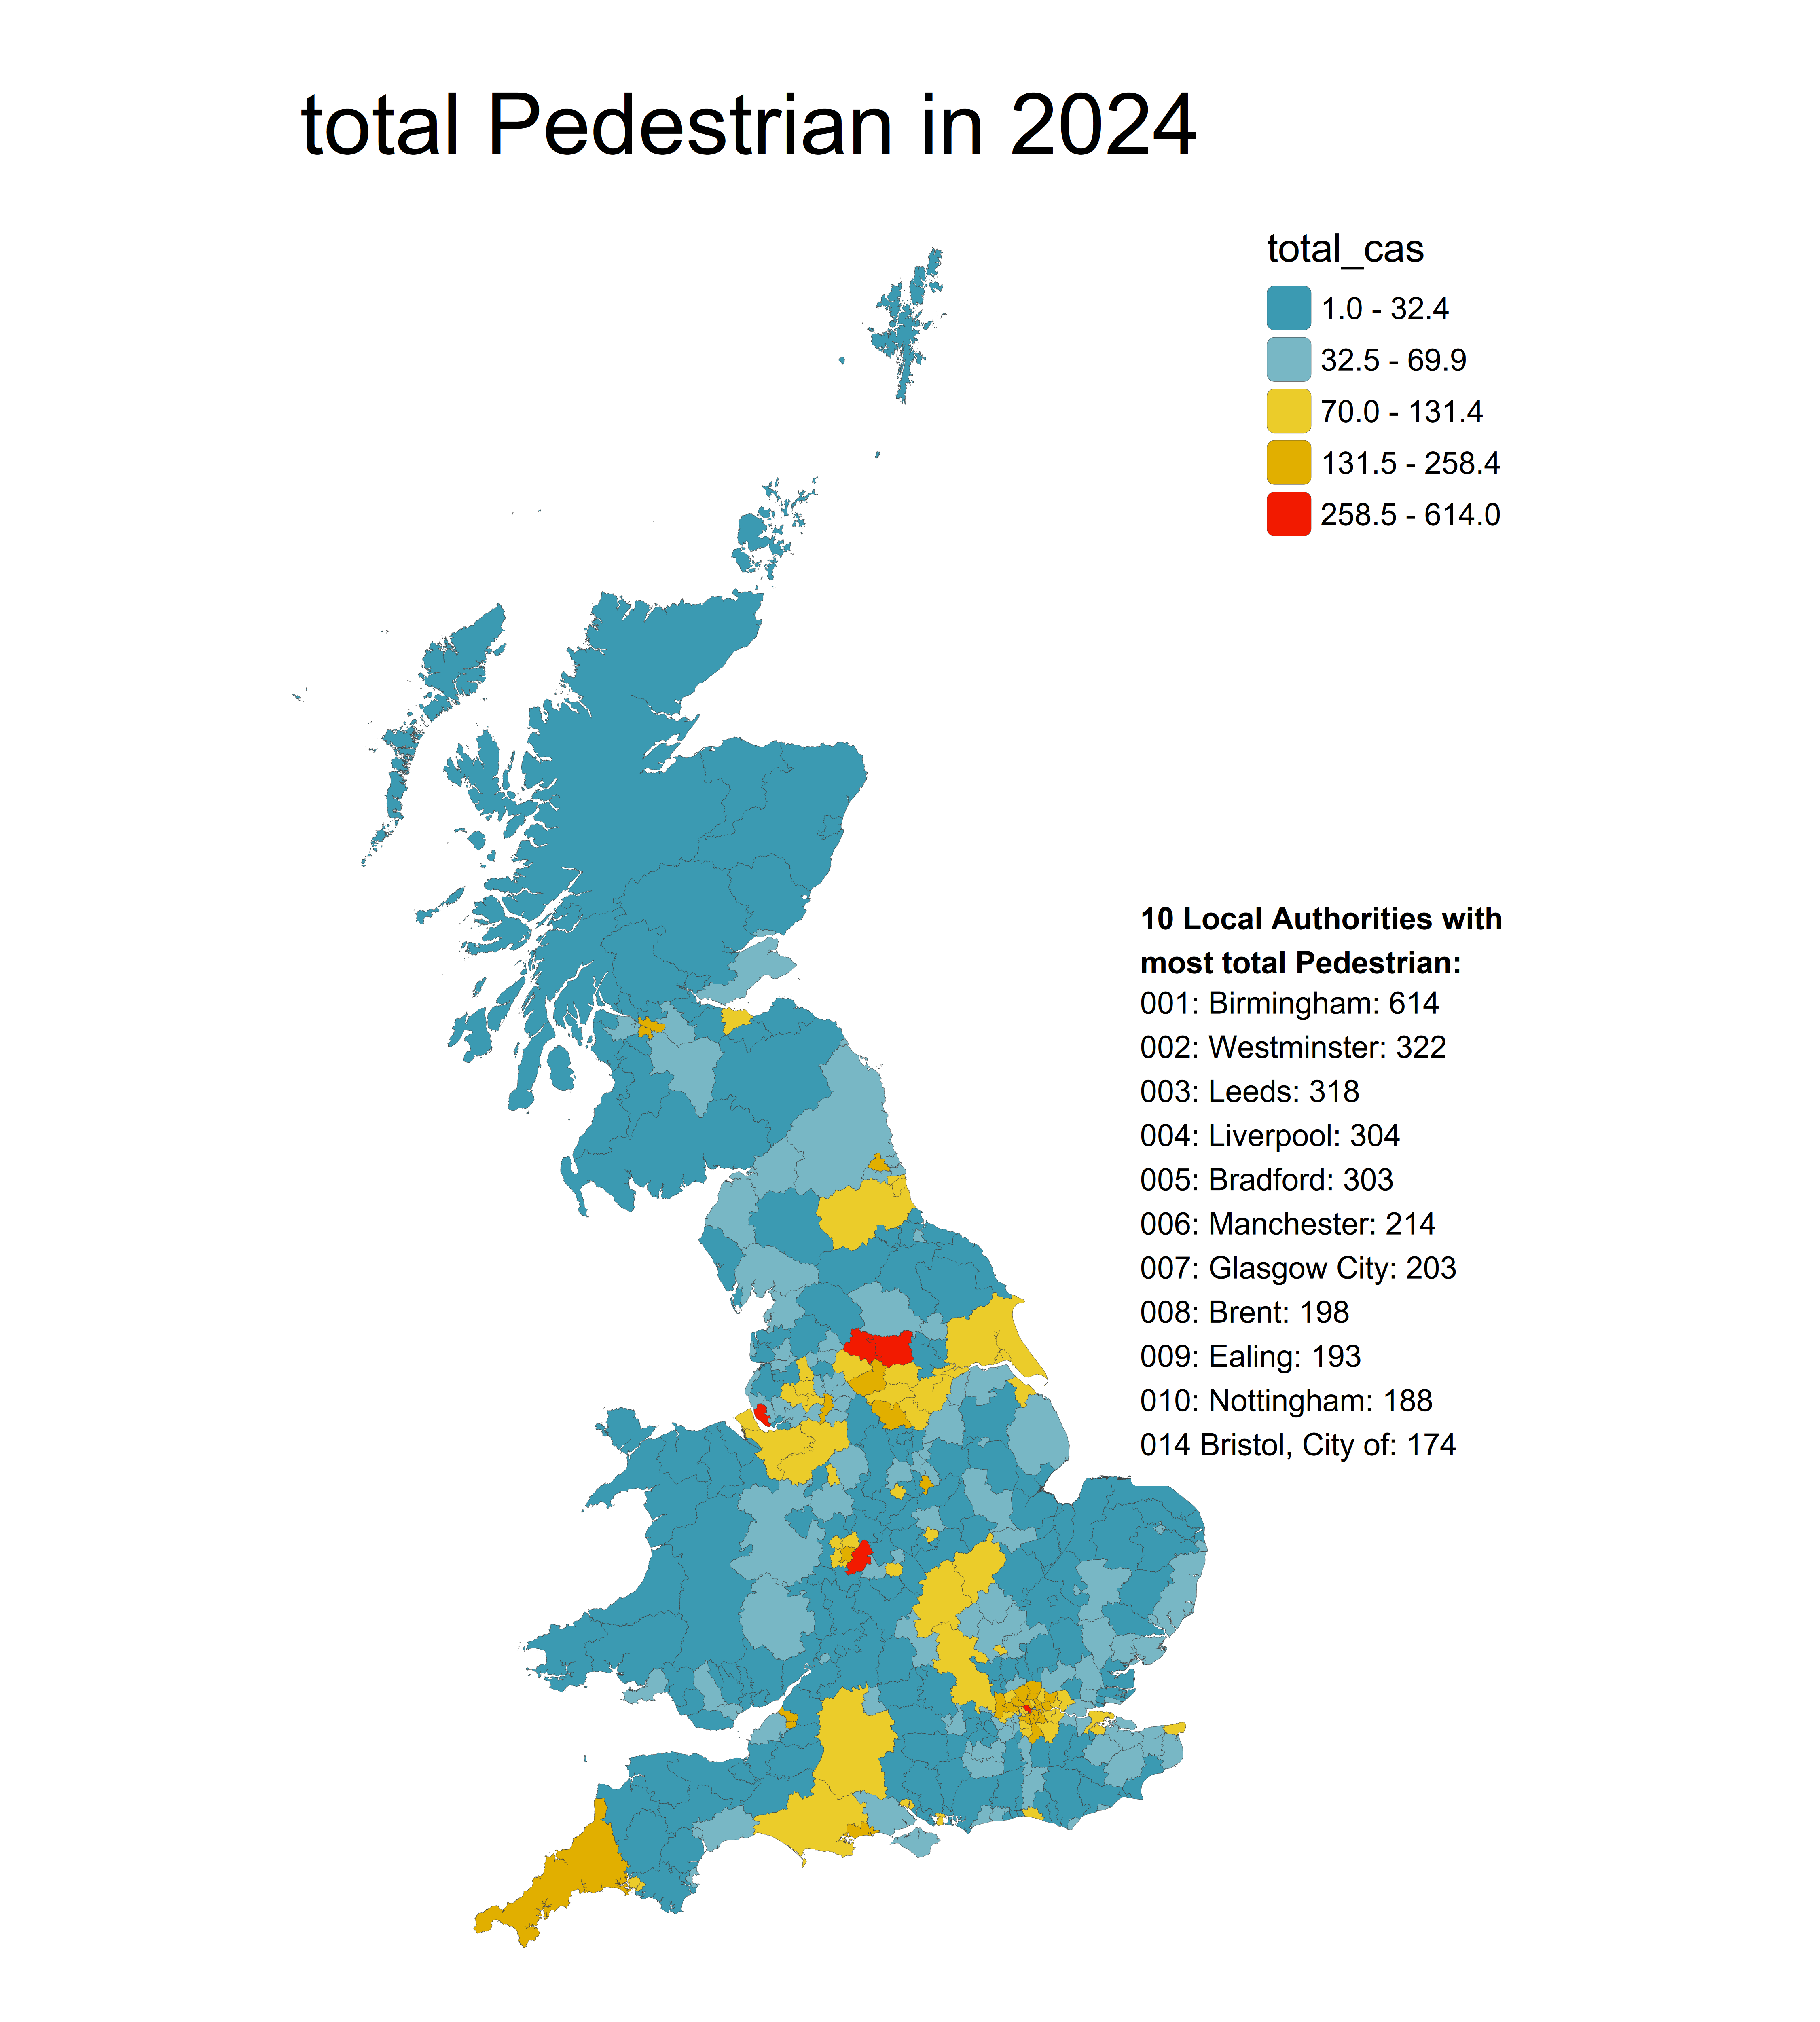
Compared to 5 years ago collisions involving pedestrians are up by 49, total casualties up by 52, fatalities up by 1, KSI casualties up by 30, serious injuries up by 29 and slight injuries up by 22.
![]()
Where in Bristol?
The interactive map at this link shows the location of all collisions between 2020 and 2024 sized by severity of the casualties and coloured by the speed limit of the road it took place on and dissagregated by casualty using the radio buttons. Clicking on each casualty provides further information about the casualty. (note: sometimes when first loading the casualty types need to be toggled a few times before they show the correct corresponding dots, clue is that bus occupants don’t make up many casualties) # {r, fig.width=100%} # #| echo: false # knitr::include_graphics("https://blaisekelly.github.io/stats19_stats/outputs/Bristol/maps/cas_location_Speed%20limit.html") # #
Grouping by street, using Open Street Maps data, the map at this link shows the collisions for each street coloured by KSI and dissagregated by year. Each street can be clicked to activate a pop-up with more details.
Road Network Analysis
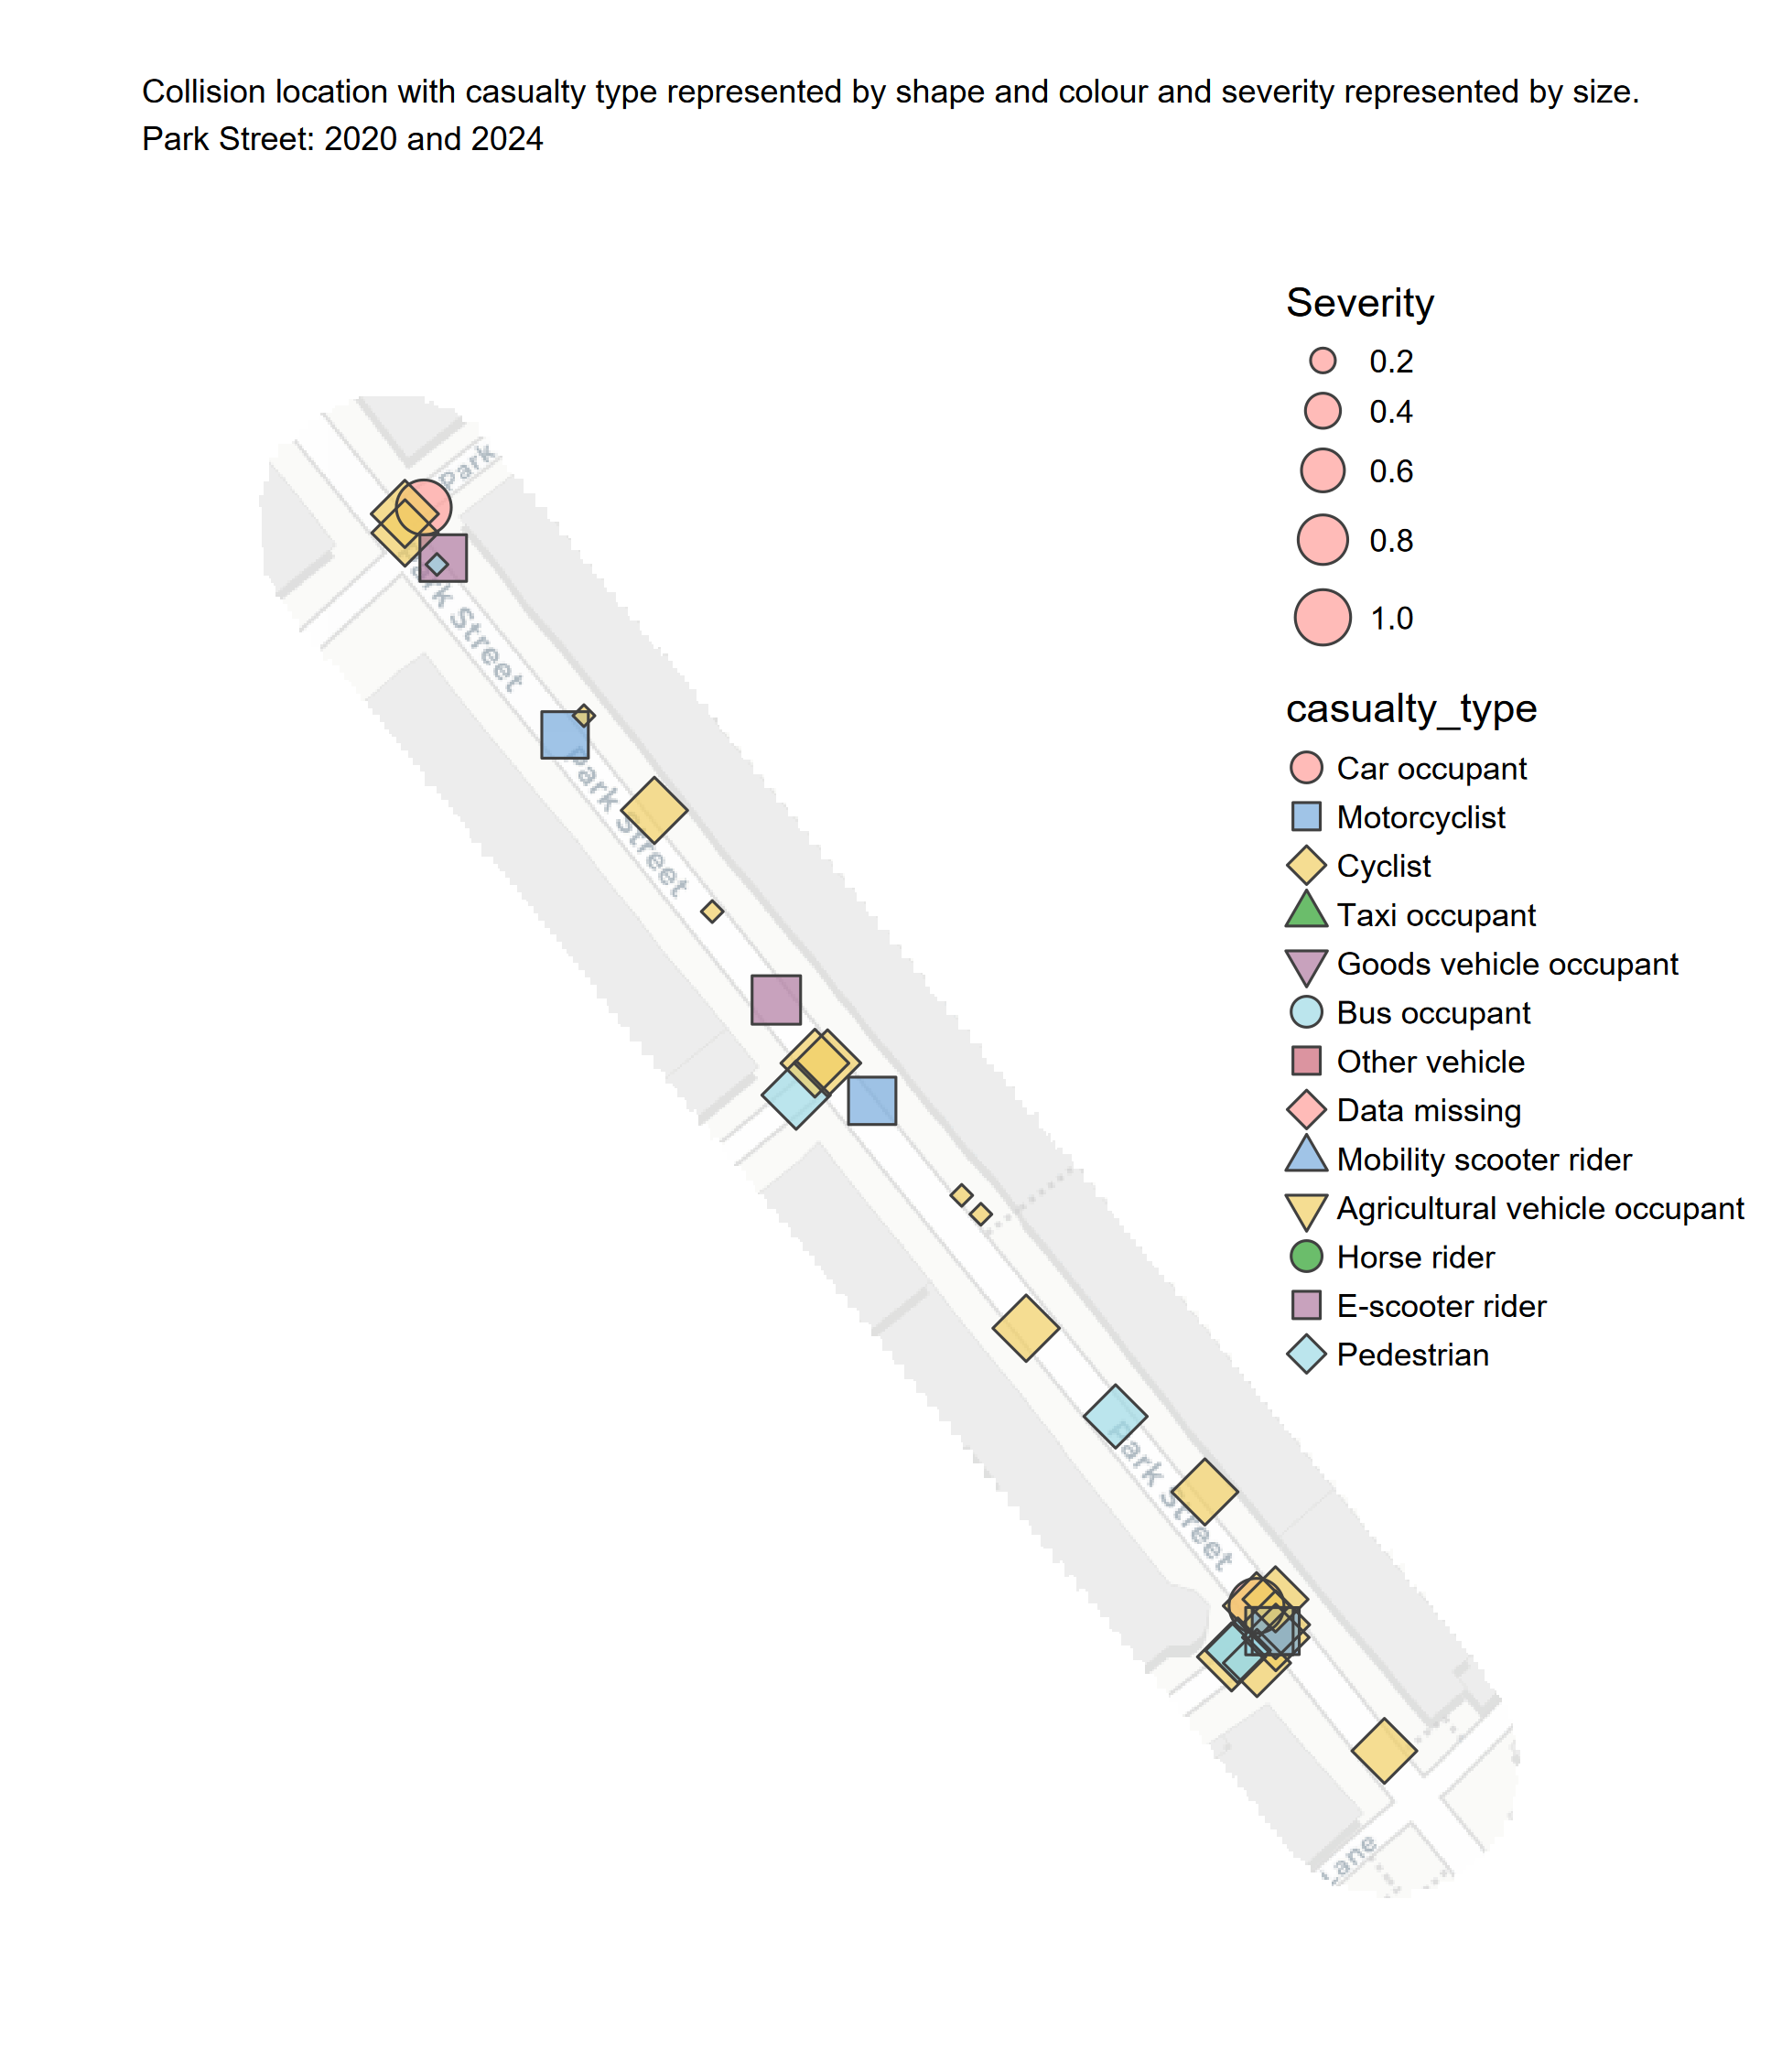
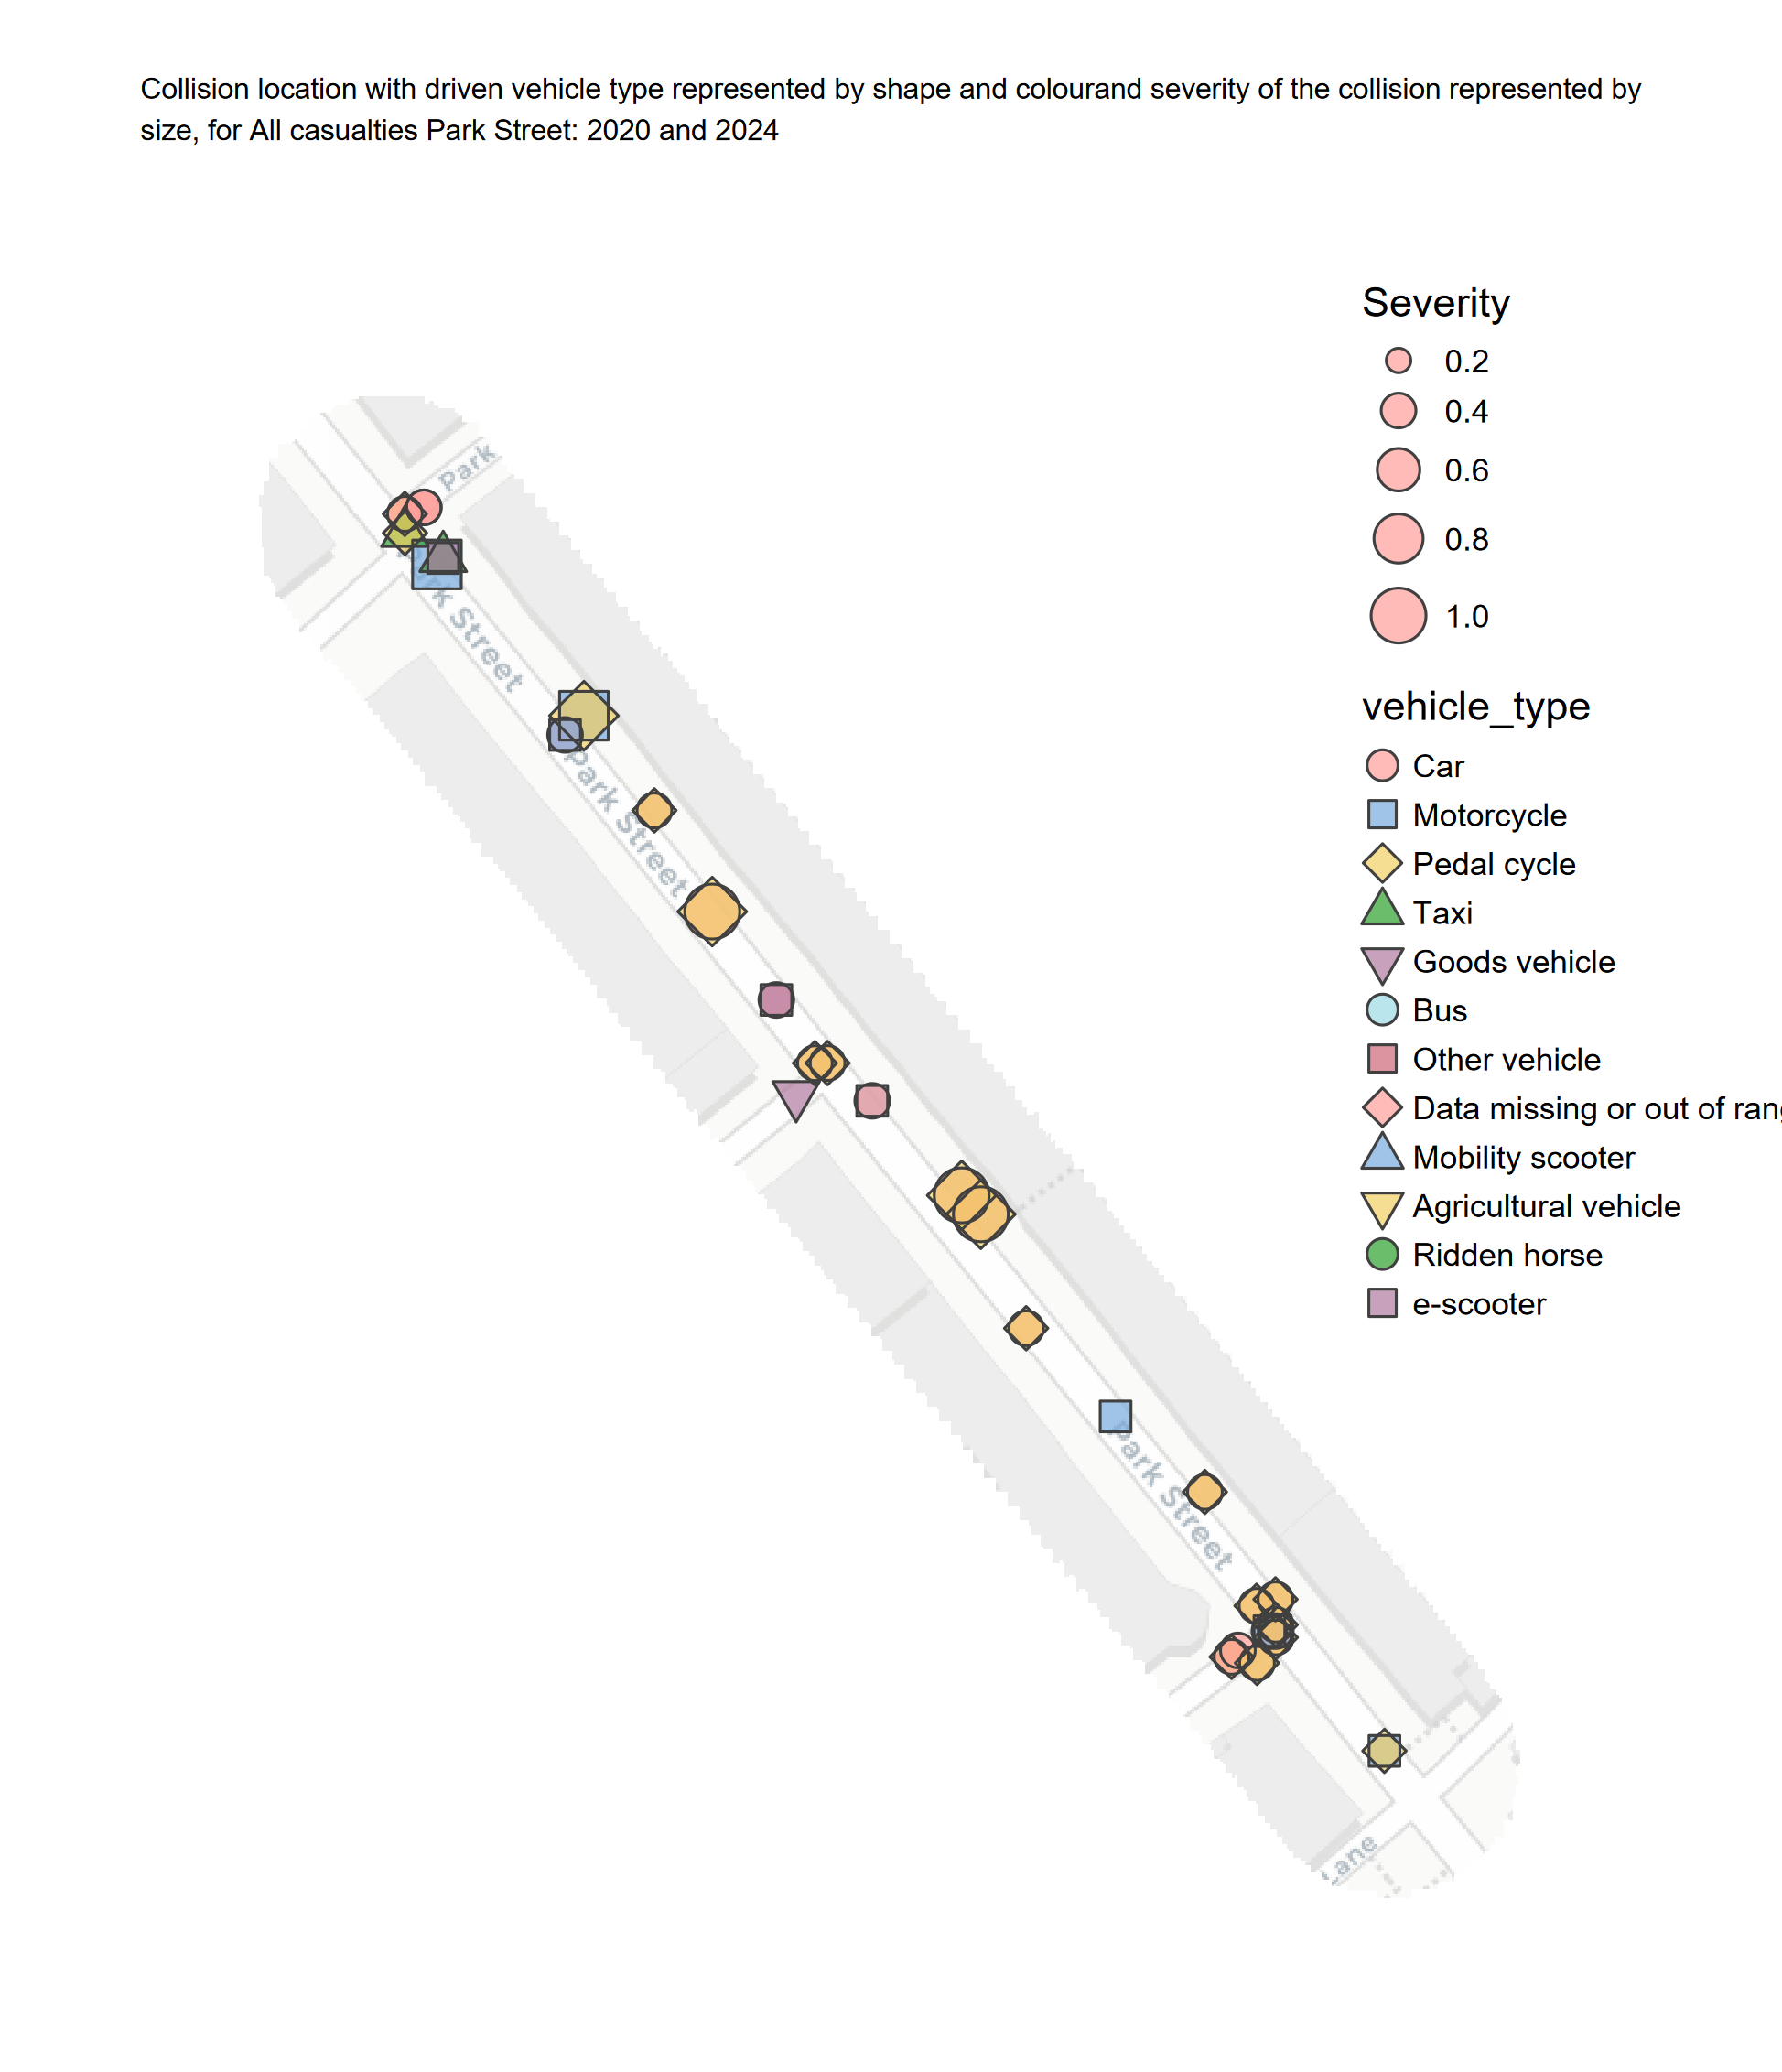
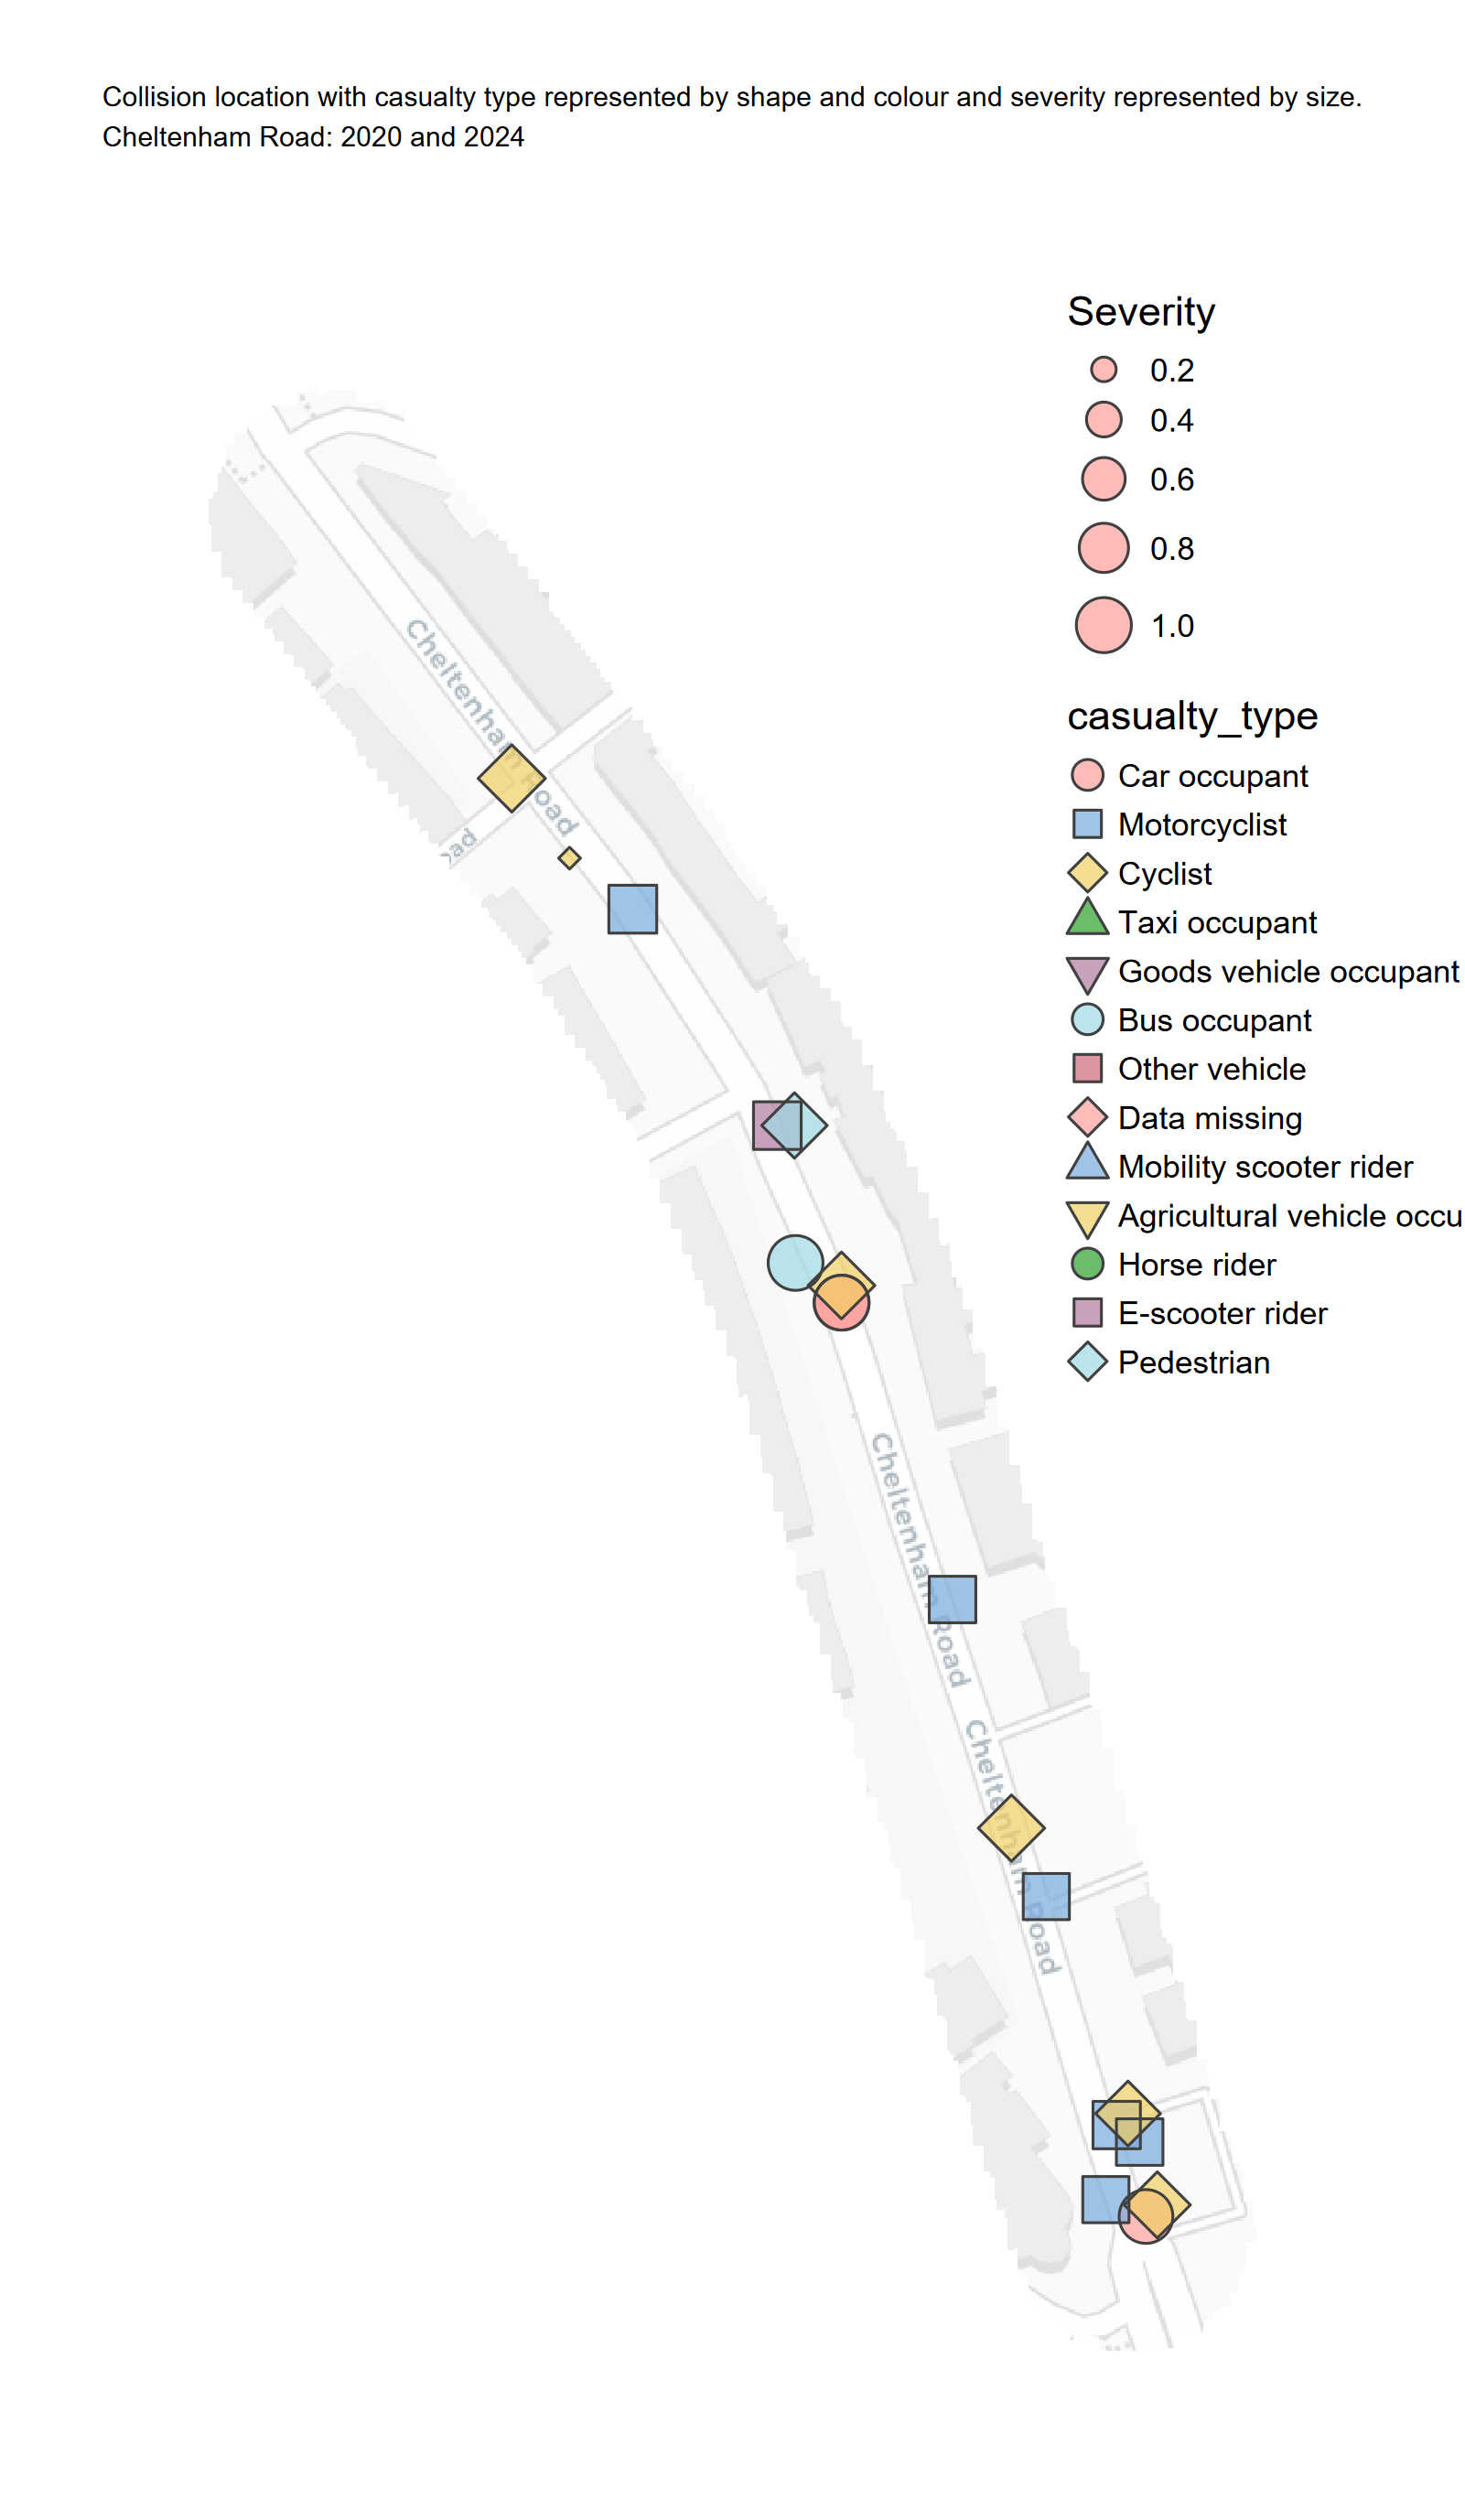
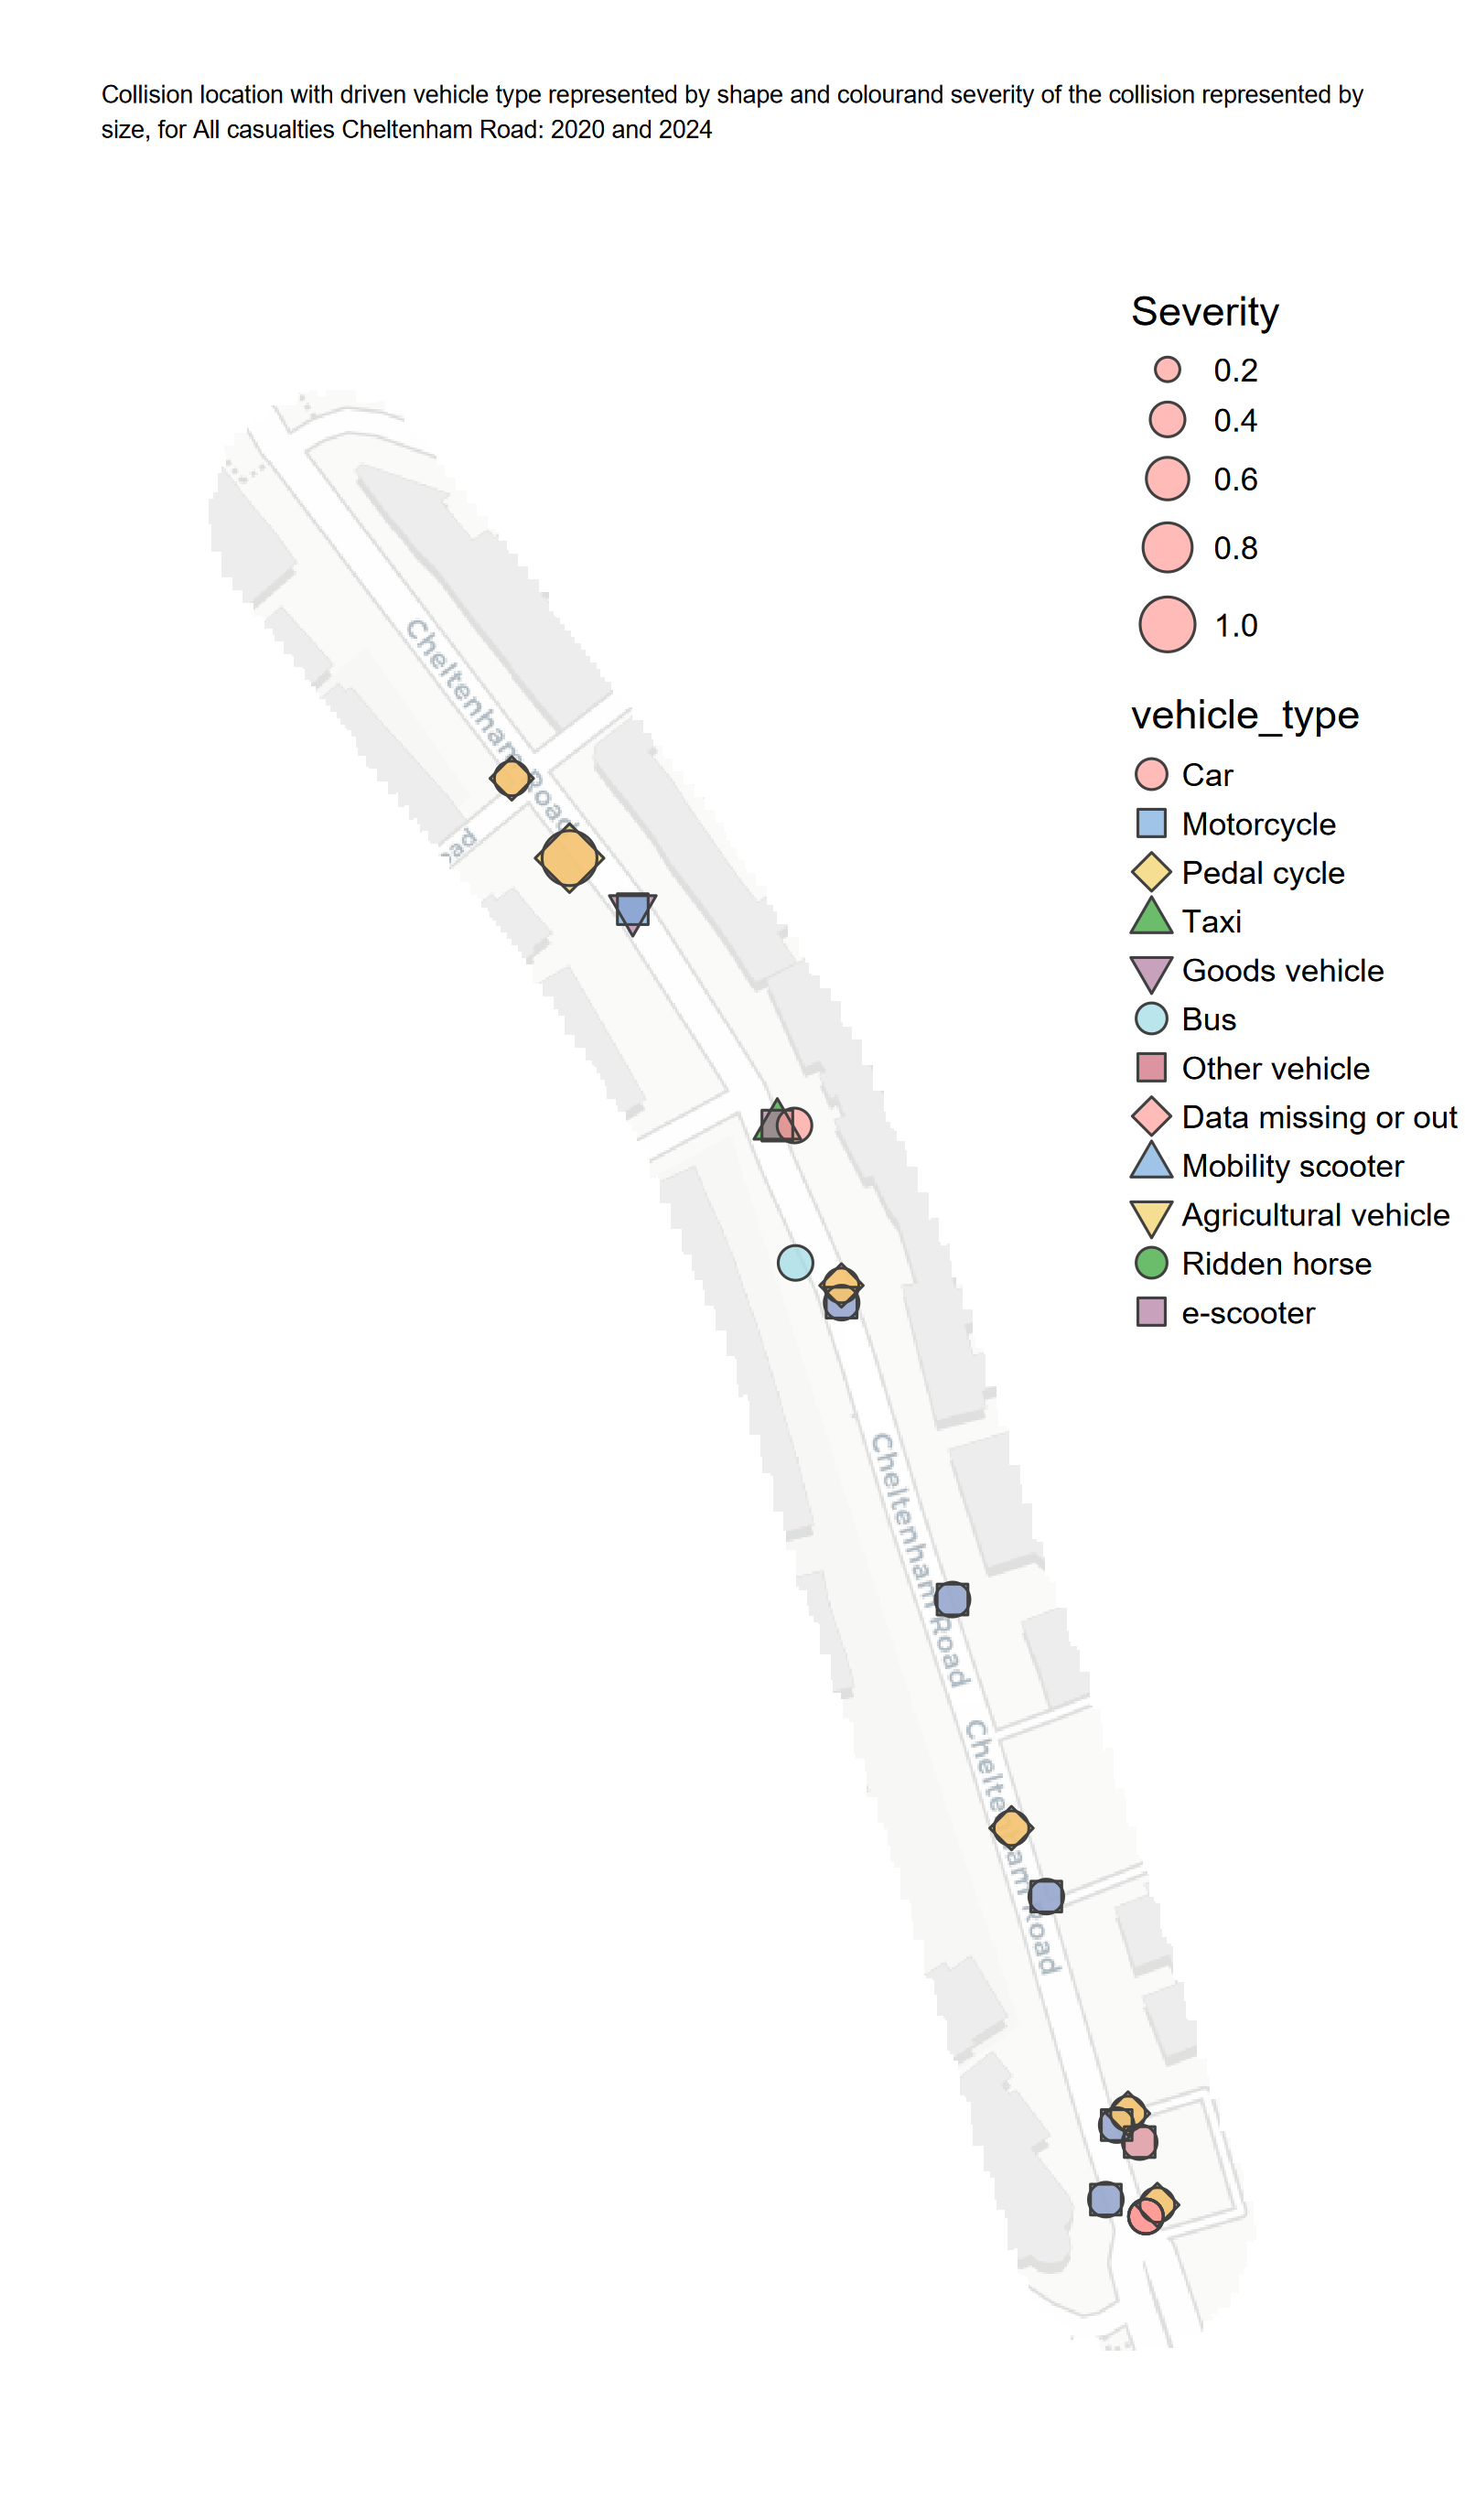
Casualty data was matched to 2205 road links from OpenStreetMap for the period 2020 to 2024, covering 3994 collisions. The road with the highest number of collisions was Park Street (20), followed by Cheltenham Road (17). Across 5 years the peak year for collisions on mapped roads was 2022 with 871 collisions. By casualty type the most common on the OSM network was Car occupant (1134 collisions). The table below shows the highest 20 roads by collision count for the full period. Click a header to sort the column.
The plots below show plots of collisions of the 2 roads with the most collisions in Bristol: Park Street and Cheltenham Road. The plot on the left represents the casualties and the plot on the right vehicles involved. To see a plot larger, right click and either save or “open in new tab”.
Speed Limits: Casualty rates by road speed limit
In Bristol, according to OSM data the majority of roads are 20mph (58%). Between 2020 and 2024 the majority of collisions (2295) happened on 20mph roads. (53)% of fatalities happened on 30mph roads, which make up 12% of roads in the LA. 356 casualties were seriously injured on 20mph roads. Collision rates per km are highest for 30mph roads, fatality rates highest on 70mph roads, serious injury rates highest on 50mph and slight injury rates 30mph. The collision rate on 20mph roads was 34% lower than the highest roads (30mph) and fatality rates 7.7% of 30mph roads and 6.7% of the highest fatality rate (70mph) roads. KSI rates were highest on 50mph roads, 3.5 times higher than 20mph roads.
The chart below shows percentage of fatalities by road speed limit.
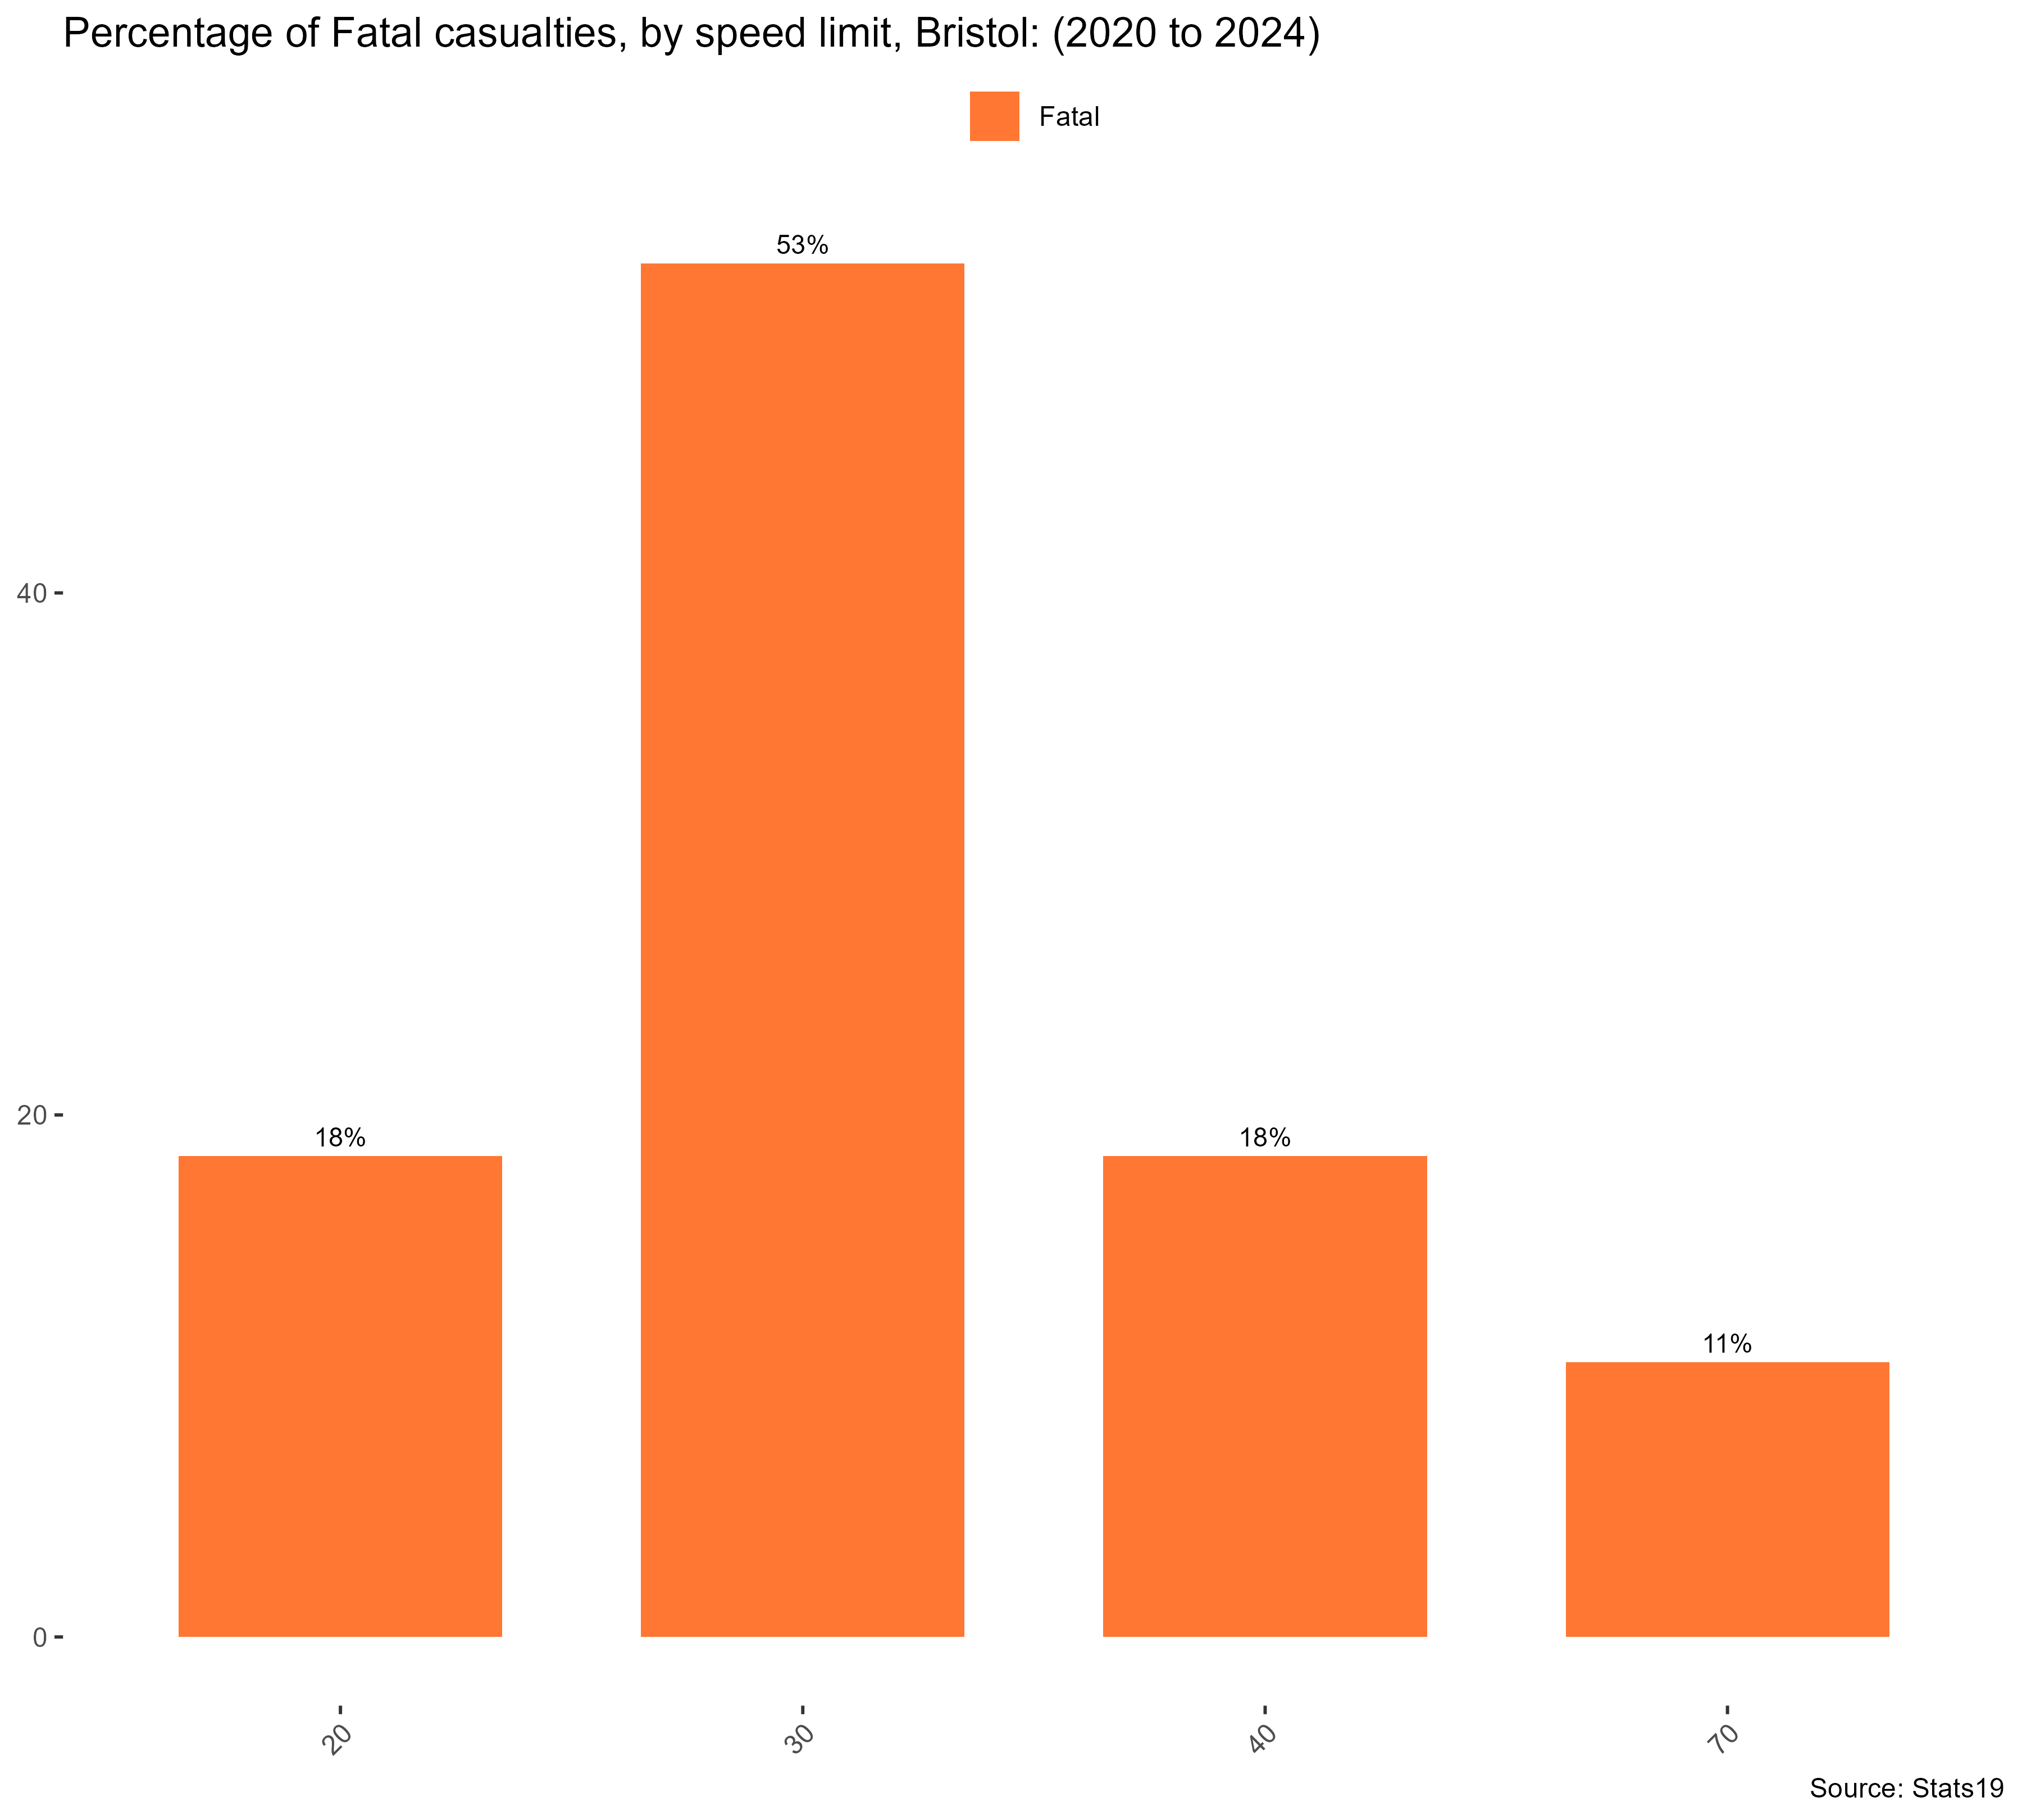
Applying the 30mph fatality rate (0.191) fatalities per 1000 collisions to the number of 20mph collisions would give 32 fatalities. Applying the per km rate of 9.46 to the 20mph road network would give a staggering 93 fatalities.
| Casualties and collisions by speed limit and road length, Bristol: 2020 to 2024 | ||||||||||||||||
| Speed Limit (mph) | Collisions | Fatal | Serious | KSI | Slight | Total length (km) | % of LA roads | Collisions per km | Fatal per km | Serious per km | KSI per km | Slight per km | Fatal per collision | Serious per collision | KSI per collision | Slight per collision |
|---|---|---|---|---|---|---|---|---|---|---|---|---|---|---|---|---|
| 20 | 2295 | 7 | 356 | 363 | 2152 | 713.4 | 57.8 | 3.22 | 0.01 | 0.50 | 0.51 | 3.02 | 0.003 | 0.155 | 0.158 | 0.938 |
| 30 | 1424 | 20 | 252 | 272 | 1403 | 150.6 | 12.2 | 9.46 | 0.13 | 1.67 | 1.81 | 9.32 | 0.014 | 0.177 | 0.191 | 0.985 |
| 40 | 222 | 7 | 42 | 49 | 225 | 51.2 | 4.1 | 4.34 | 0.14 | 0.82 | 0.96 | 4.39 | 0.032 | 0.189 | 0.221 | 1.014 |
| 50 | 9 | 0 | 4 | 4 | 8 | 2.1 | 0.2 | 4.29 | 0.00 | 1.90 | 1.90 | 3.81 | 0.000 | 0.444 | 0.444 | 0.889 |
| 60 | 7 | 0 | 2 | 2 | 7 | 4.2 | 0.3 | 1.67 | 0.00 | 0.48 | 0.48 | 1.67 | 0.000 | 0.286 | 0.286 | 1.000 |
| 70 | 37 | 4 | 10 | 14 | 54 | 27.4 | 2.2 | 1.35 | 0.15 | 0.36 | 0.51 | 1.97 | 0.108 | 0.270 | 0.378 | 1.459 |
| Source: DfT STATS19 and OSM | ||||||||||||||||
Grouping by area and IMD
LSOA.
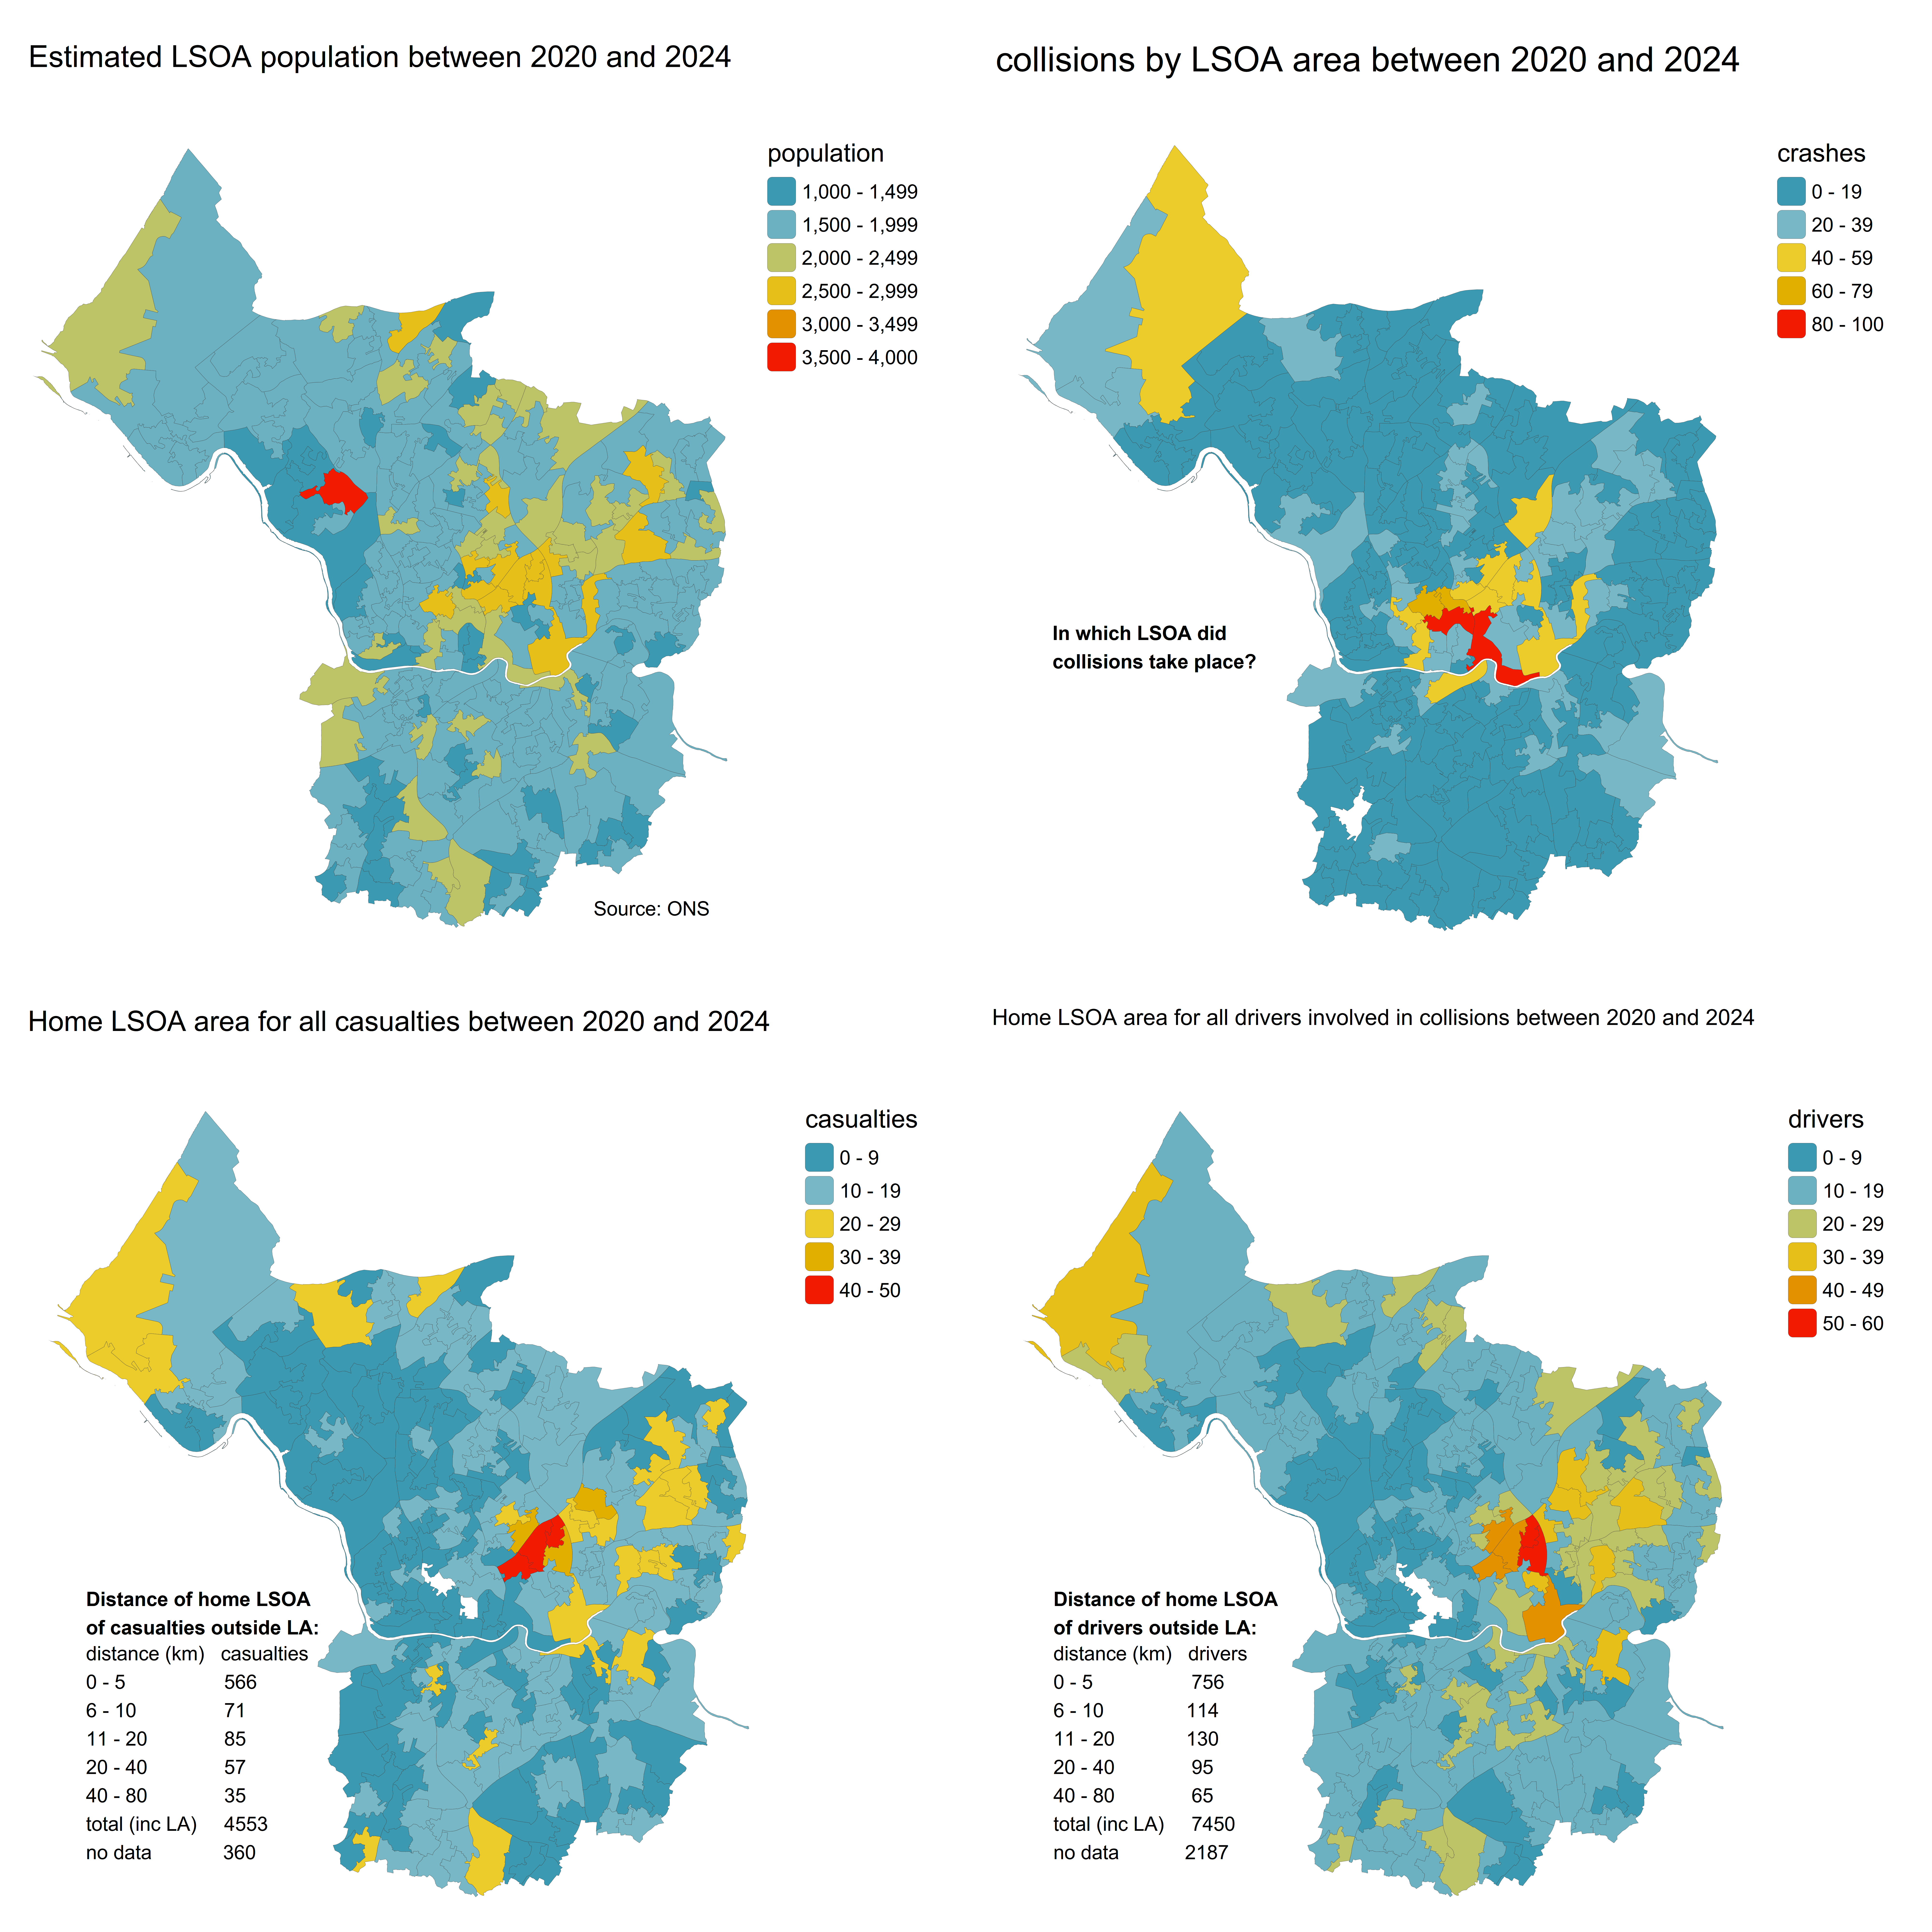
The top left plot below show the distribution of the population by LSOA zone, the most granular population data available for the whole of Great Britain. In the top right are the number of total collisions by LSOA zone, calculated by intersecting the crash data with the LSOA shape files and the bottom two plots shows the home LSOA of casualties and vehicles involved in collisions in the city.
Relationship with Index of Multiple Deprivation Decile (IMD)
The Index of Multiple Deprivation (IMD) is the official measure of relative deprivation in England and is part of a suite of outputs that form the Indices of Deprivation (IoD) given as a decile in the STATS19 casualty and vehicle data for the casualty and drivers home LSOA respectively. It follows an established methodological framework in broadly defining deprivation to encompass a wide range of an individual’s living conditions. It is important in road traffic collision analysis because it says something about where harm is distributed in society. In Bristol, 55.2% of the population fall into the most deprived IMD decile. 67% of casualties injured between 2020 and 2024 fall into the most deprived IMD decile. 92.1% of casualty data had home LSOA.
IMD and Casualties
The relationship between deprivation and road casualty risk is marked in Bristol. The most deprived IMD decile (decile 1) accounts for 18.6% of casualties (780), while the least deprived (decile 10) accounts for 5.7% (241). Residents of the most deprived areas are 3.2 times more likely to be a casualty than those in the least deprived decile. The decile with the highest number of casualties overall is decile 1 with 40 casualties (1%). As noted above, 92.1% of casualty records had a home LSOA that could be matched to an IMD decile, where as only xx of driver data had data on home location.
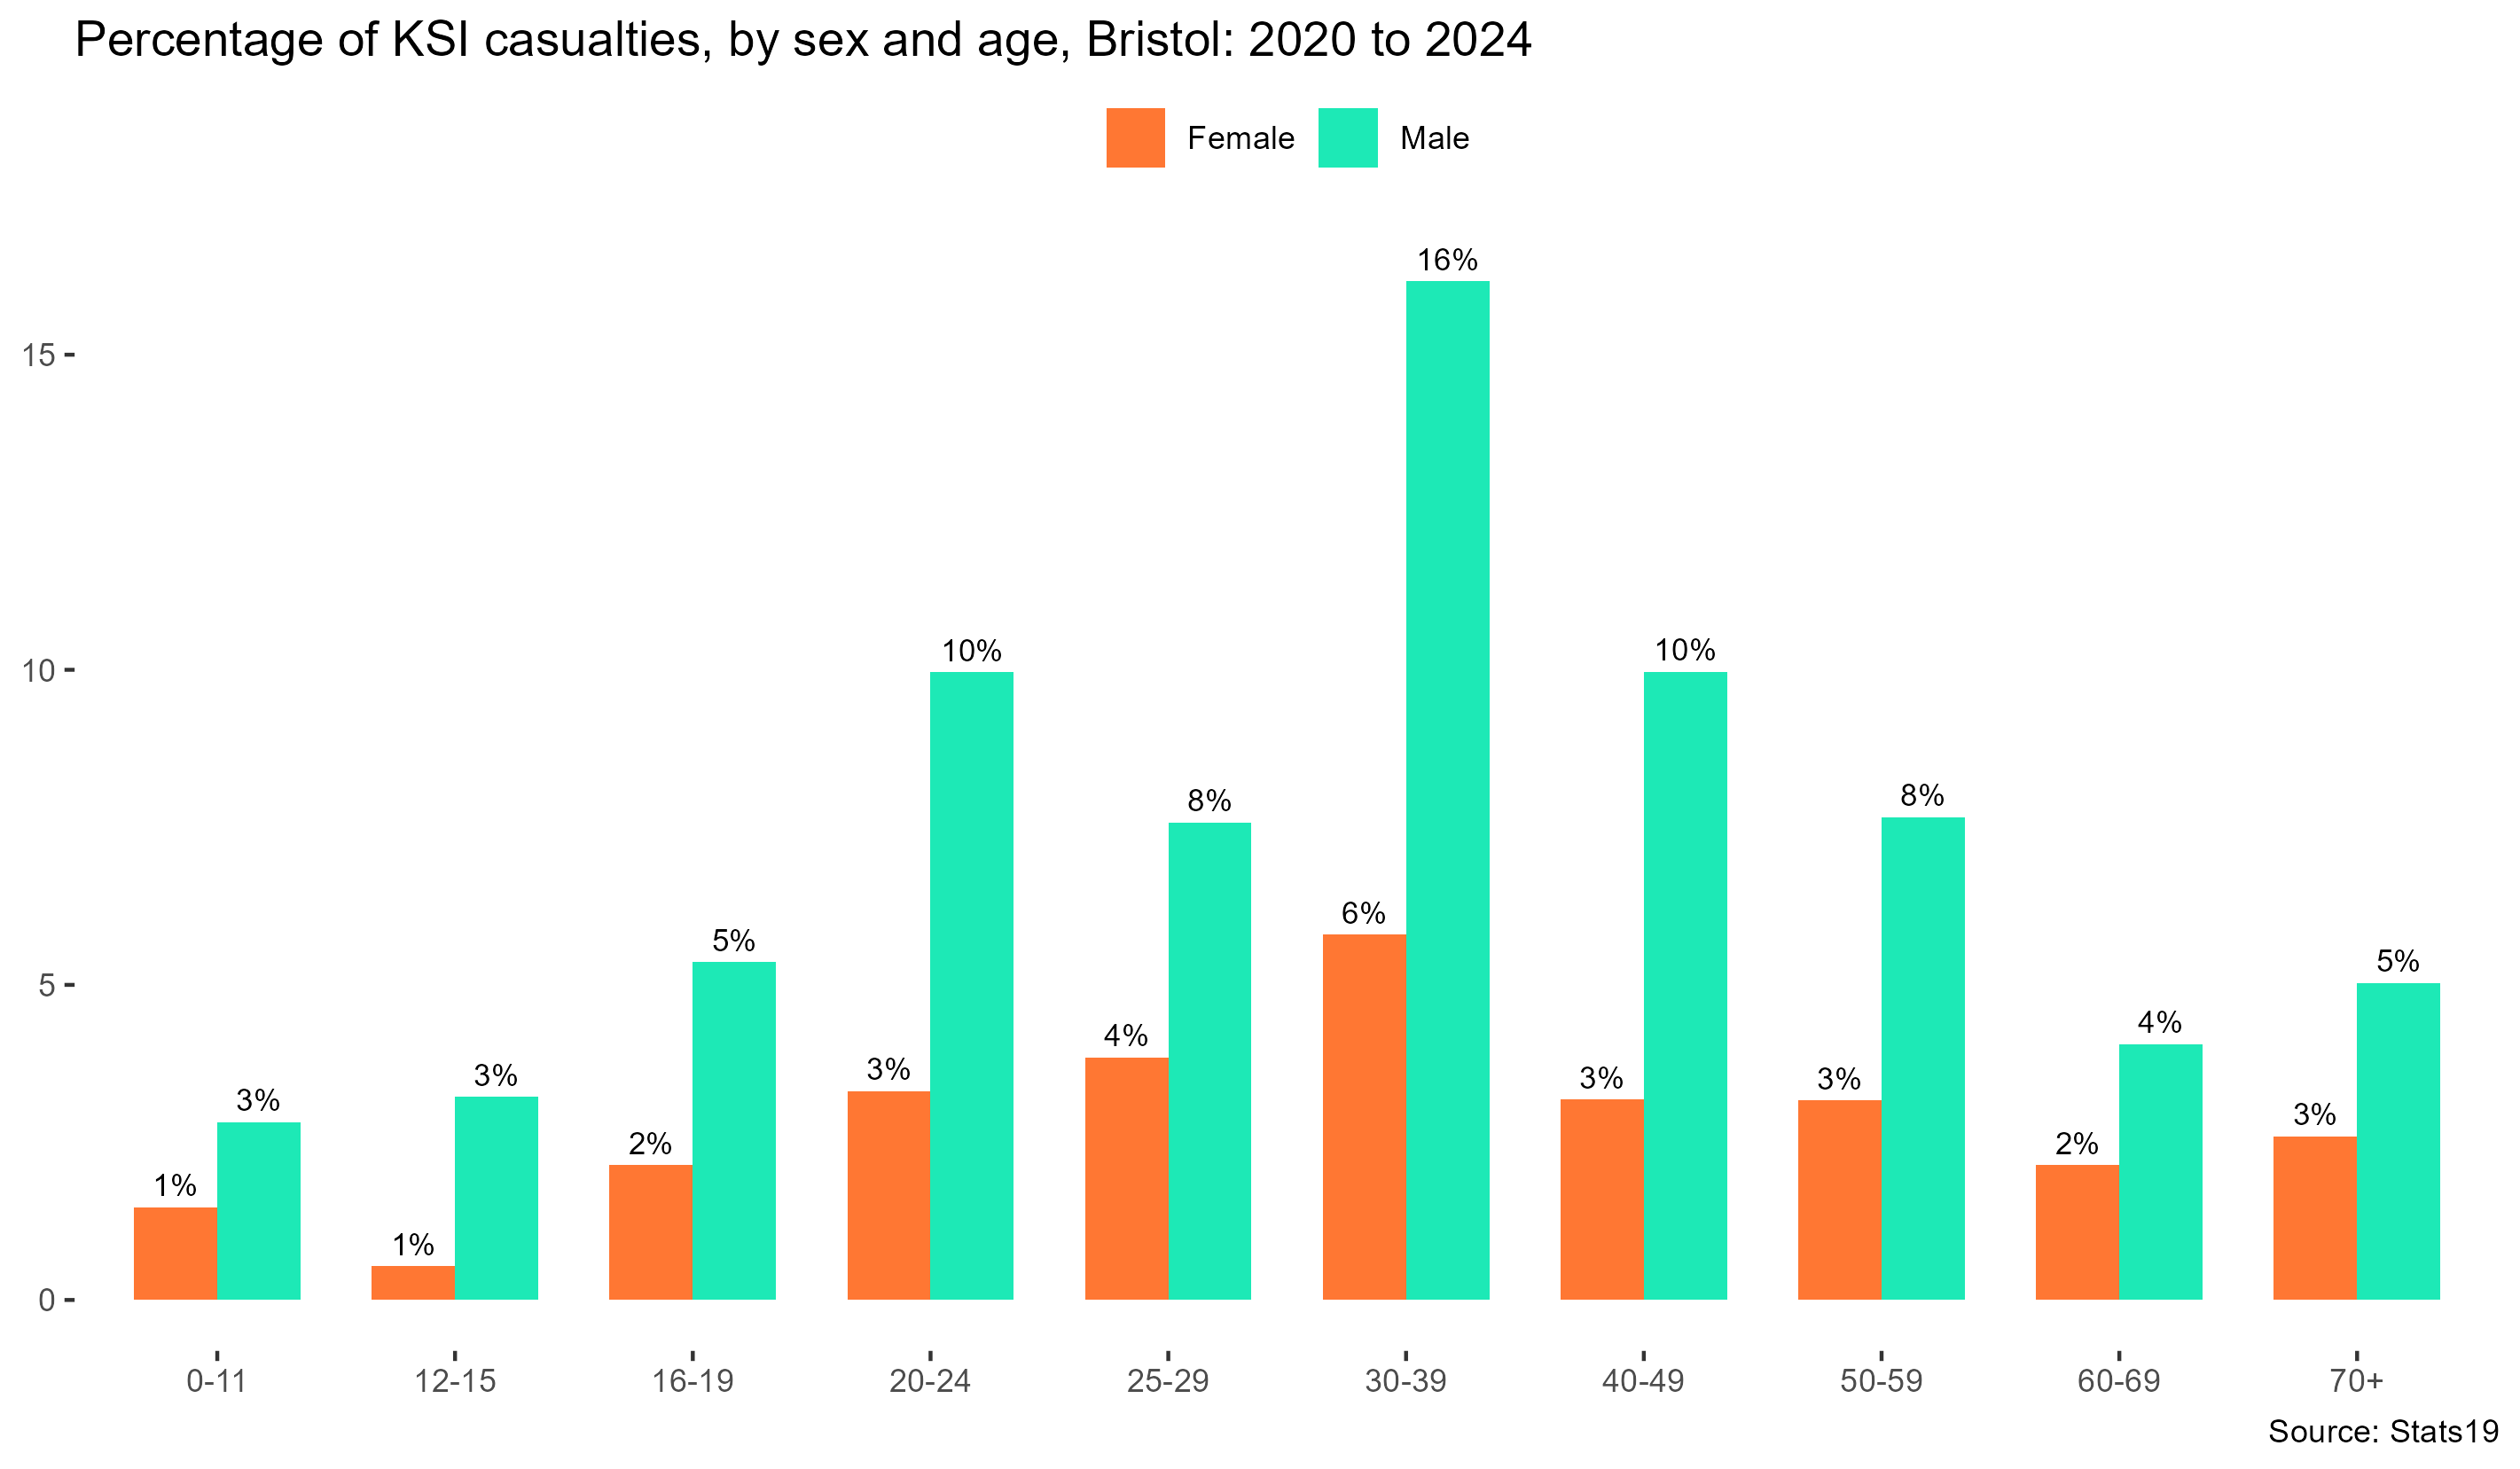
The charts below show a breakdown of the ages and sex number of KSI and IMD Decil of casualties in Bristol.
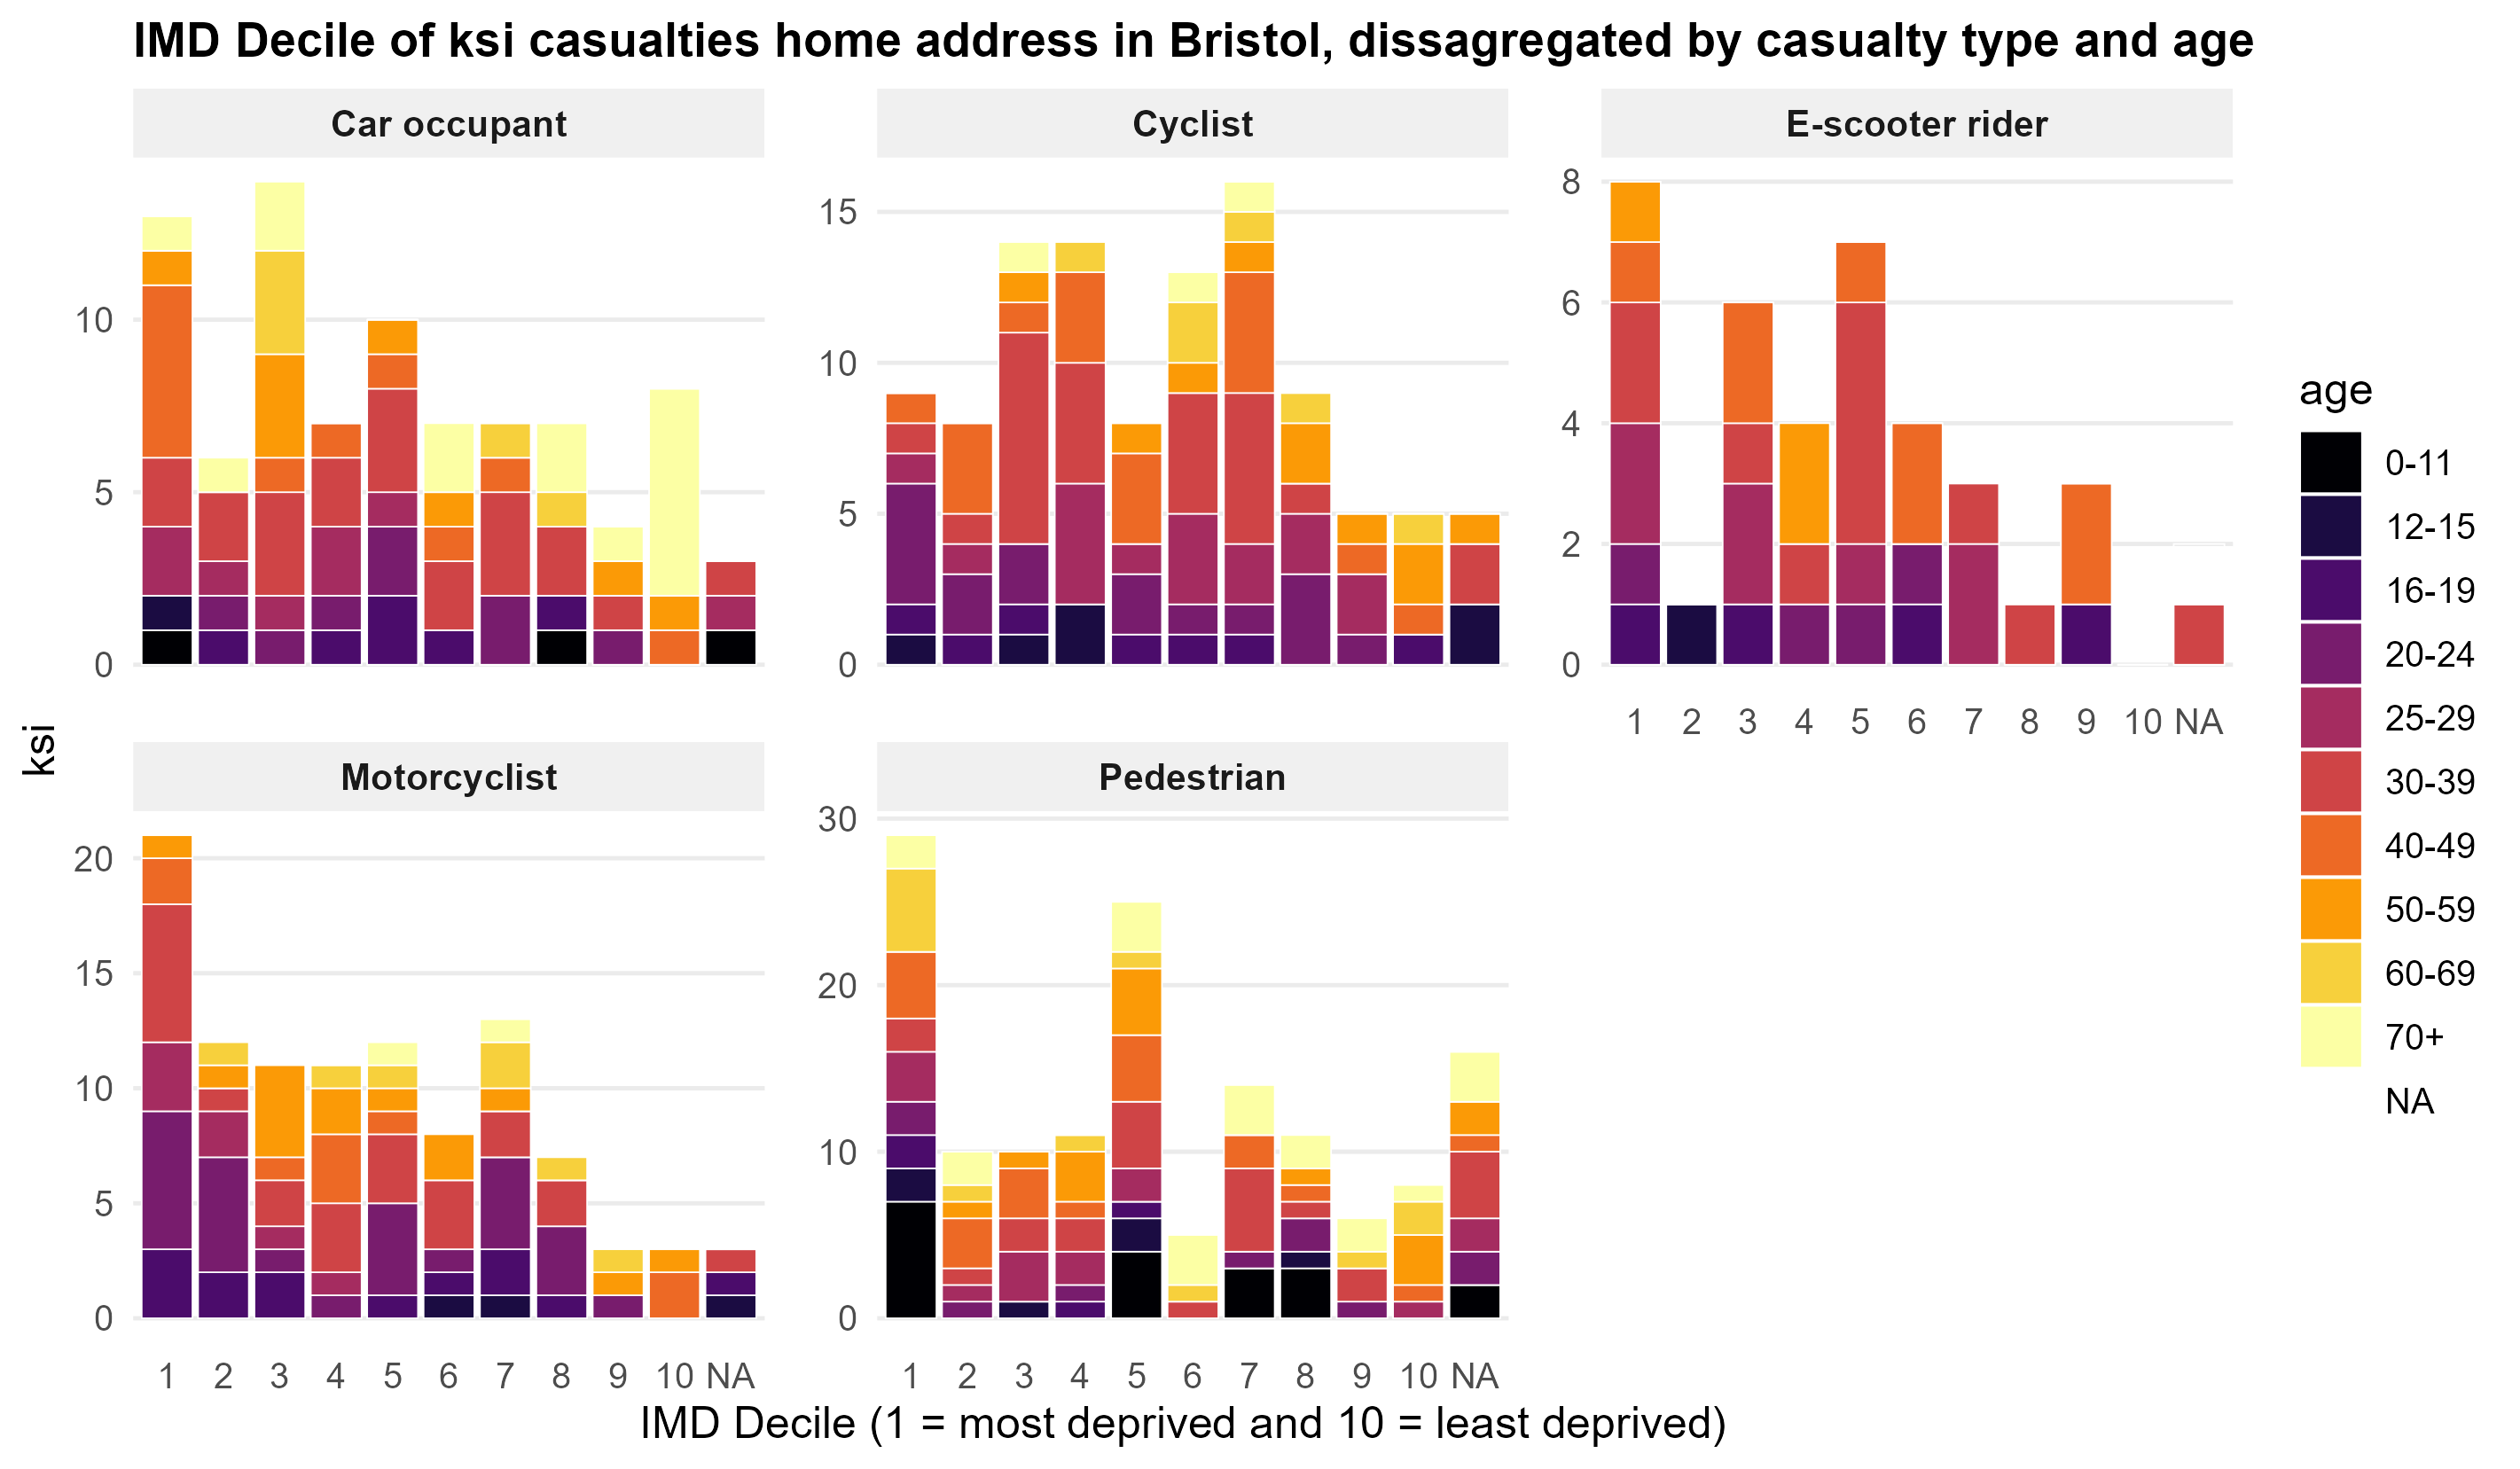
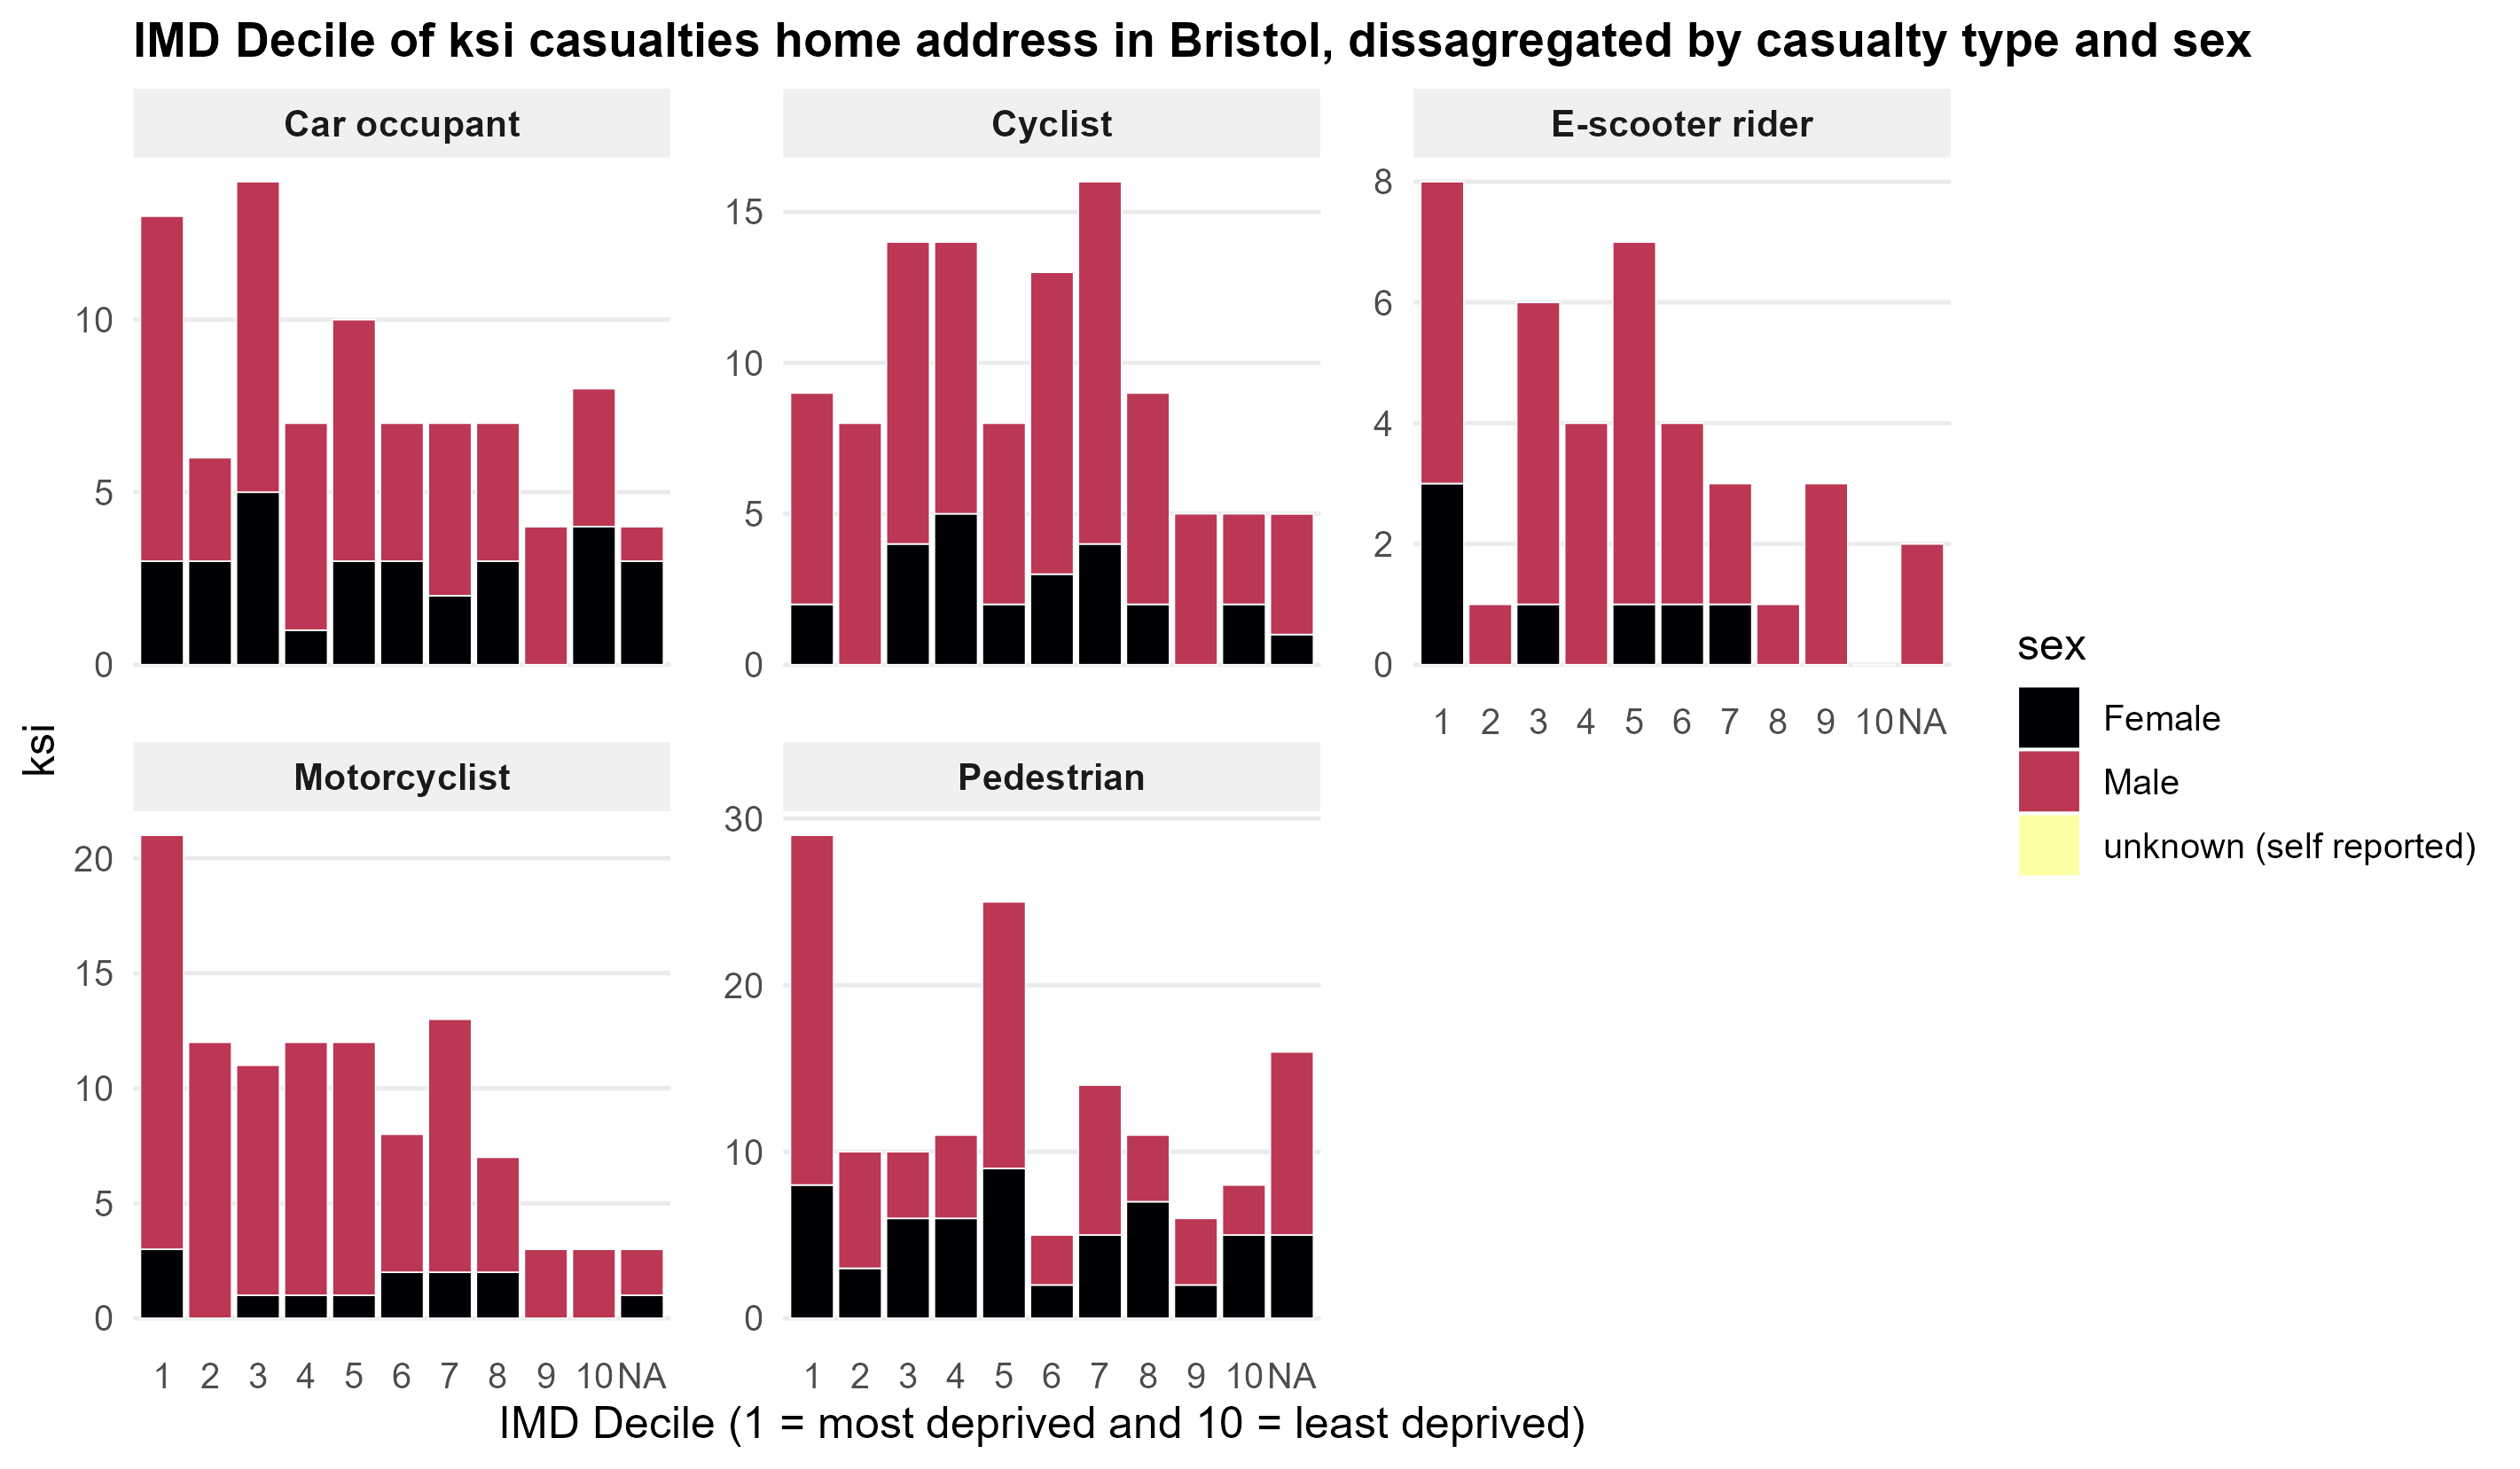
Analysis of KSI casualties by IMD decile in Bristol reveals that decile 1 (most deprived) accounts for the highest KSI total across casualty types combined, with approximately 115 KSI casualties. Pedestrians represent the highest KSI casualty type overall (~177). Pedestrian KSI peaks in decile 1, while cyclist KSI is highest in decile 7. By age, the most affected groups are 30-39 for pedestrians, 30-39 for cyclists, and 20-24 for motorcyclists. Males account for approximately 461 KSI casualties compared to 179 for females.
MSOA
Between LSOA and Local Authority are Medium Super Output Levels (MSOA). Because of their relatively consistent size across the country, they are a useful unit for analysing data about small local areas and they also have been allocated descriptive names by the House of Commons Library makming it easier to describe areas. These areas have been used to analyse casualties by MSOA region and compare at a country level, similar to as has been done with LAs at the beginning of this document, but hopefully providing more targeted information for a local area.
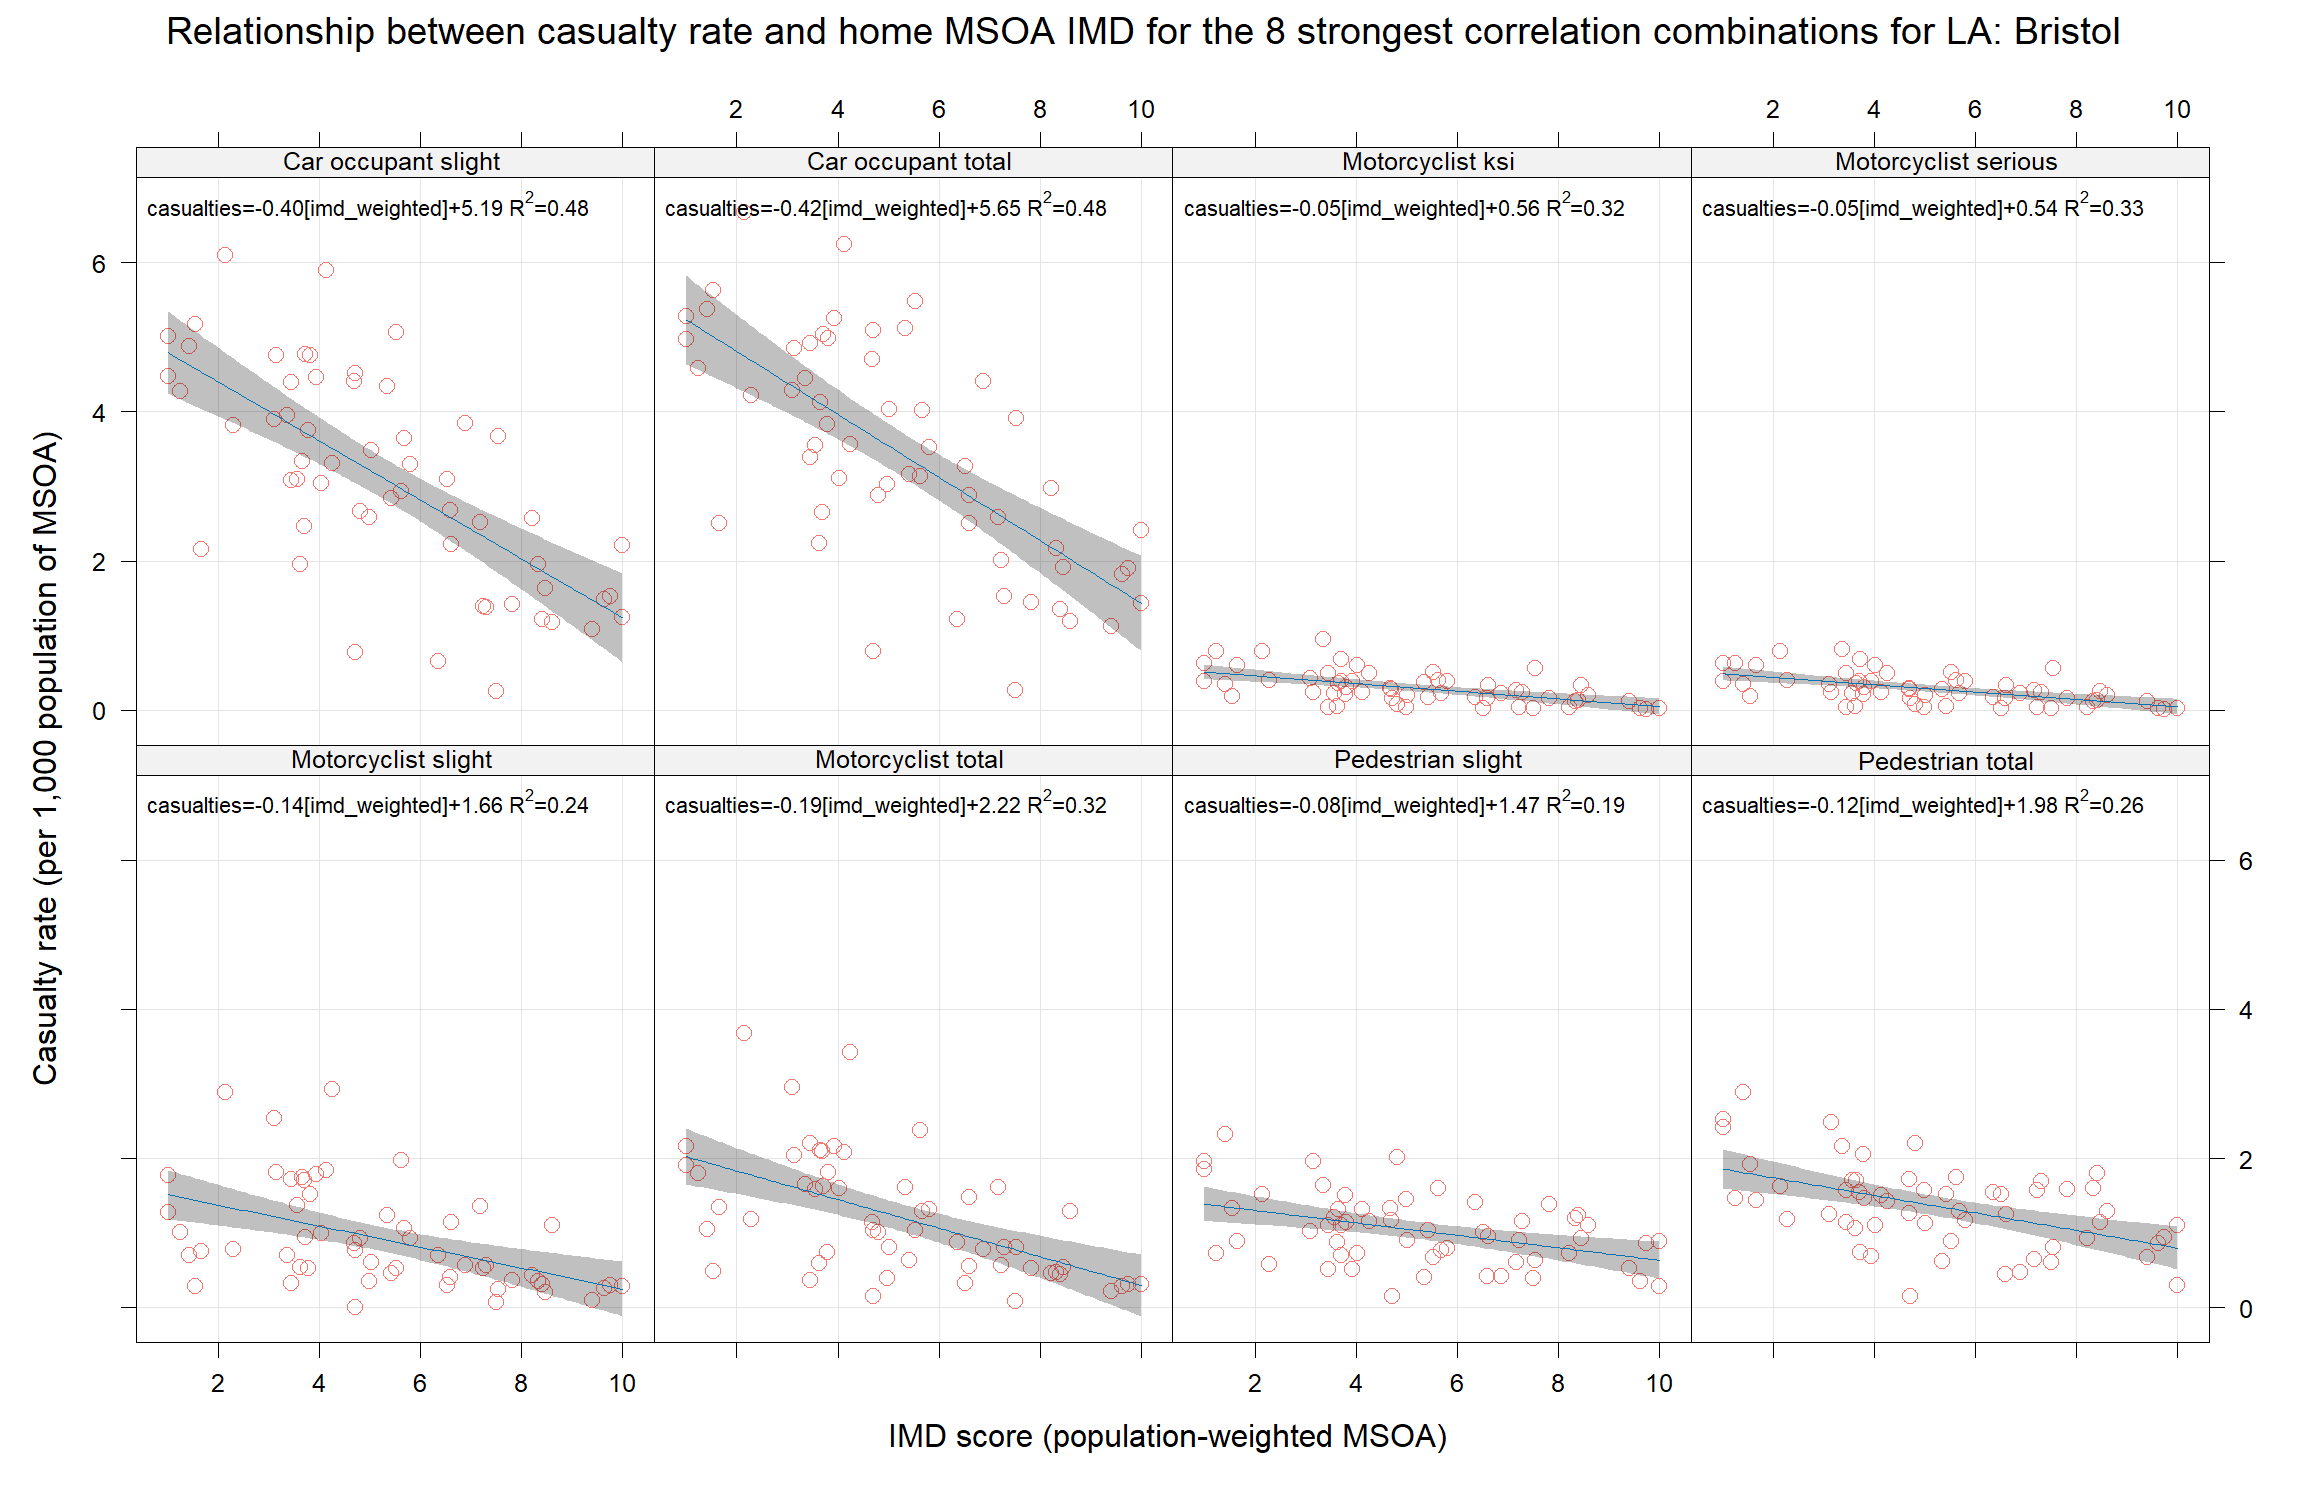
Analysing the population weighted IMD from LSOA for MSOA for different casualty types, the strongest trends are for Car occupant, Motorcyclist, Pedestrian casualties as shown in the plot below.
The table below shows data for the 57 MSOA areas in Bristol where casualties live and ranked against other MSOAs nationally. Casualties involved in collisions outside of Bristol are also included. Between 2020 and 2024, the MSOA with the highest number of casualties was Southmead with 142 casualties. The most deprived MSOA (by weighted IMD score) was Hartcliffe (IMD 10), while the least deprived was Westbury-on-Trym (IMD 1). The highest MSOA regions per capita where casualties live in Bristol are Sea Mills, ranked 407 nationally out of 7264 for fatalities per capita, Highridge ranked 1499 for KSIs, Highridge ranked 1617 for Serious casualties.
Casualty Demographics
Between 2020 and 2024, 64.1% of all casualties in Bristol were male and 35.9% were female. Males also accounted for 71.8% of KSI casualties. The most common age band for casualties was 30-39 (24.9% of all casualties), while the highest KSI rate was among the 30-39 age band (22% of all KSI). The table below shows the full breakdown of casualties by age band and sex, with severity and the percentage share of KSI and all casualties.
Cost of prevention
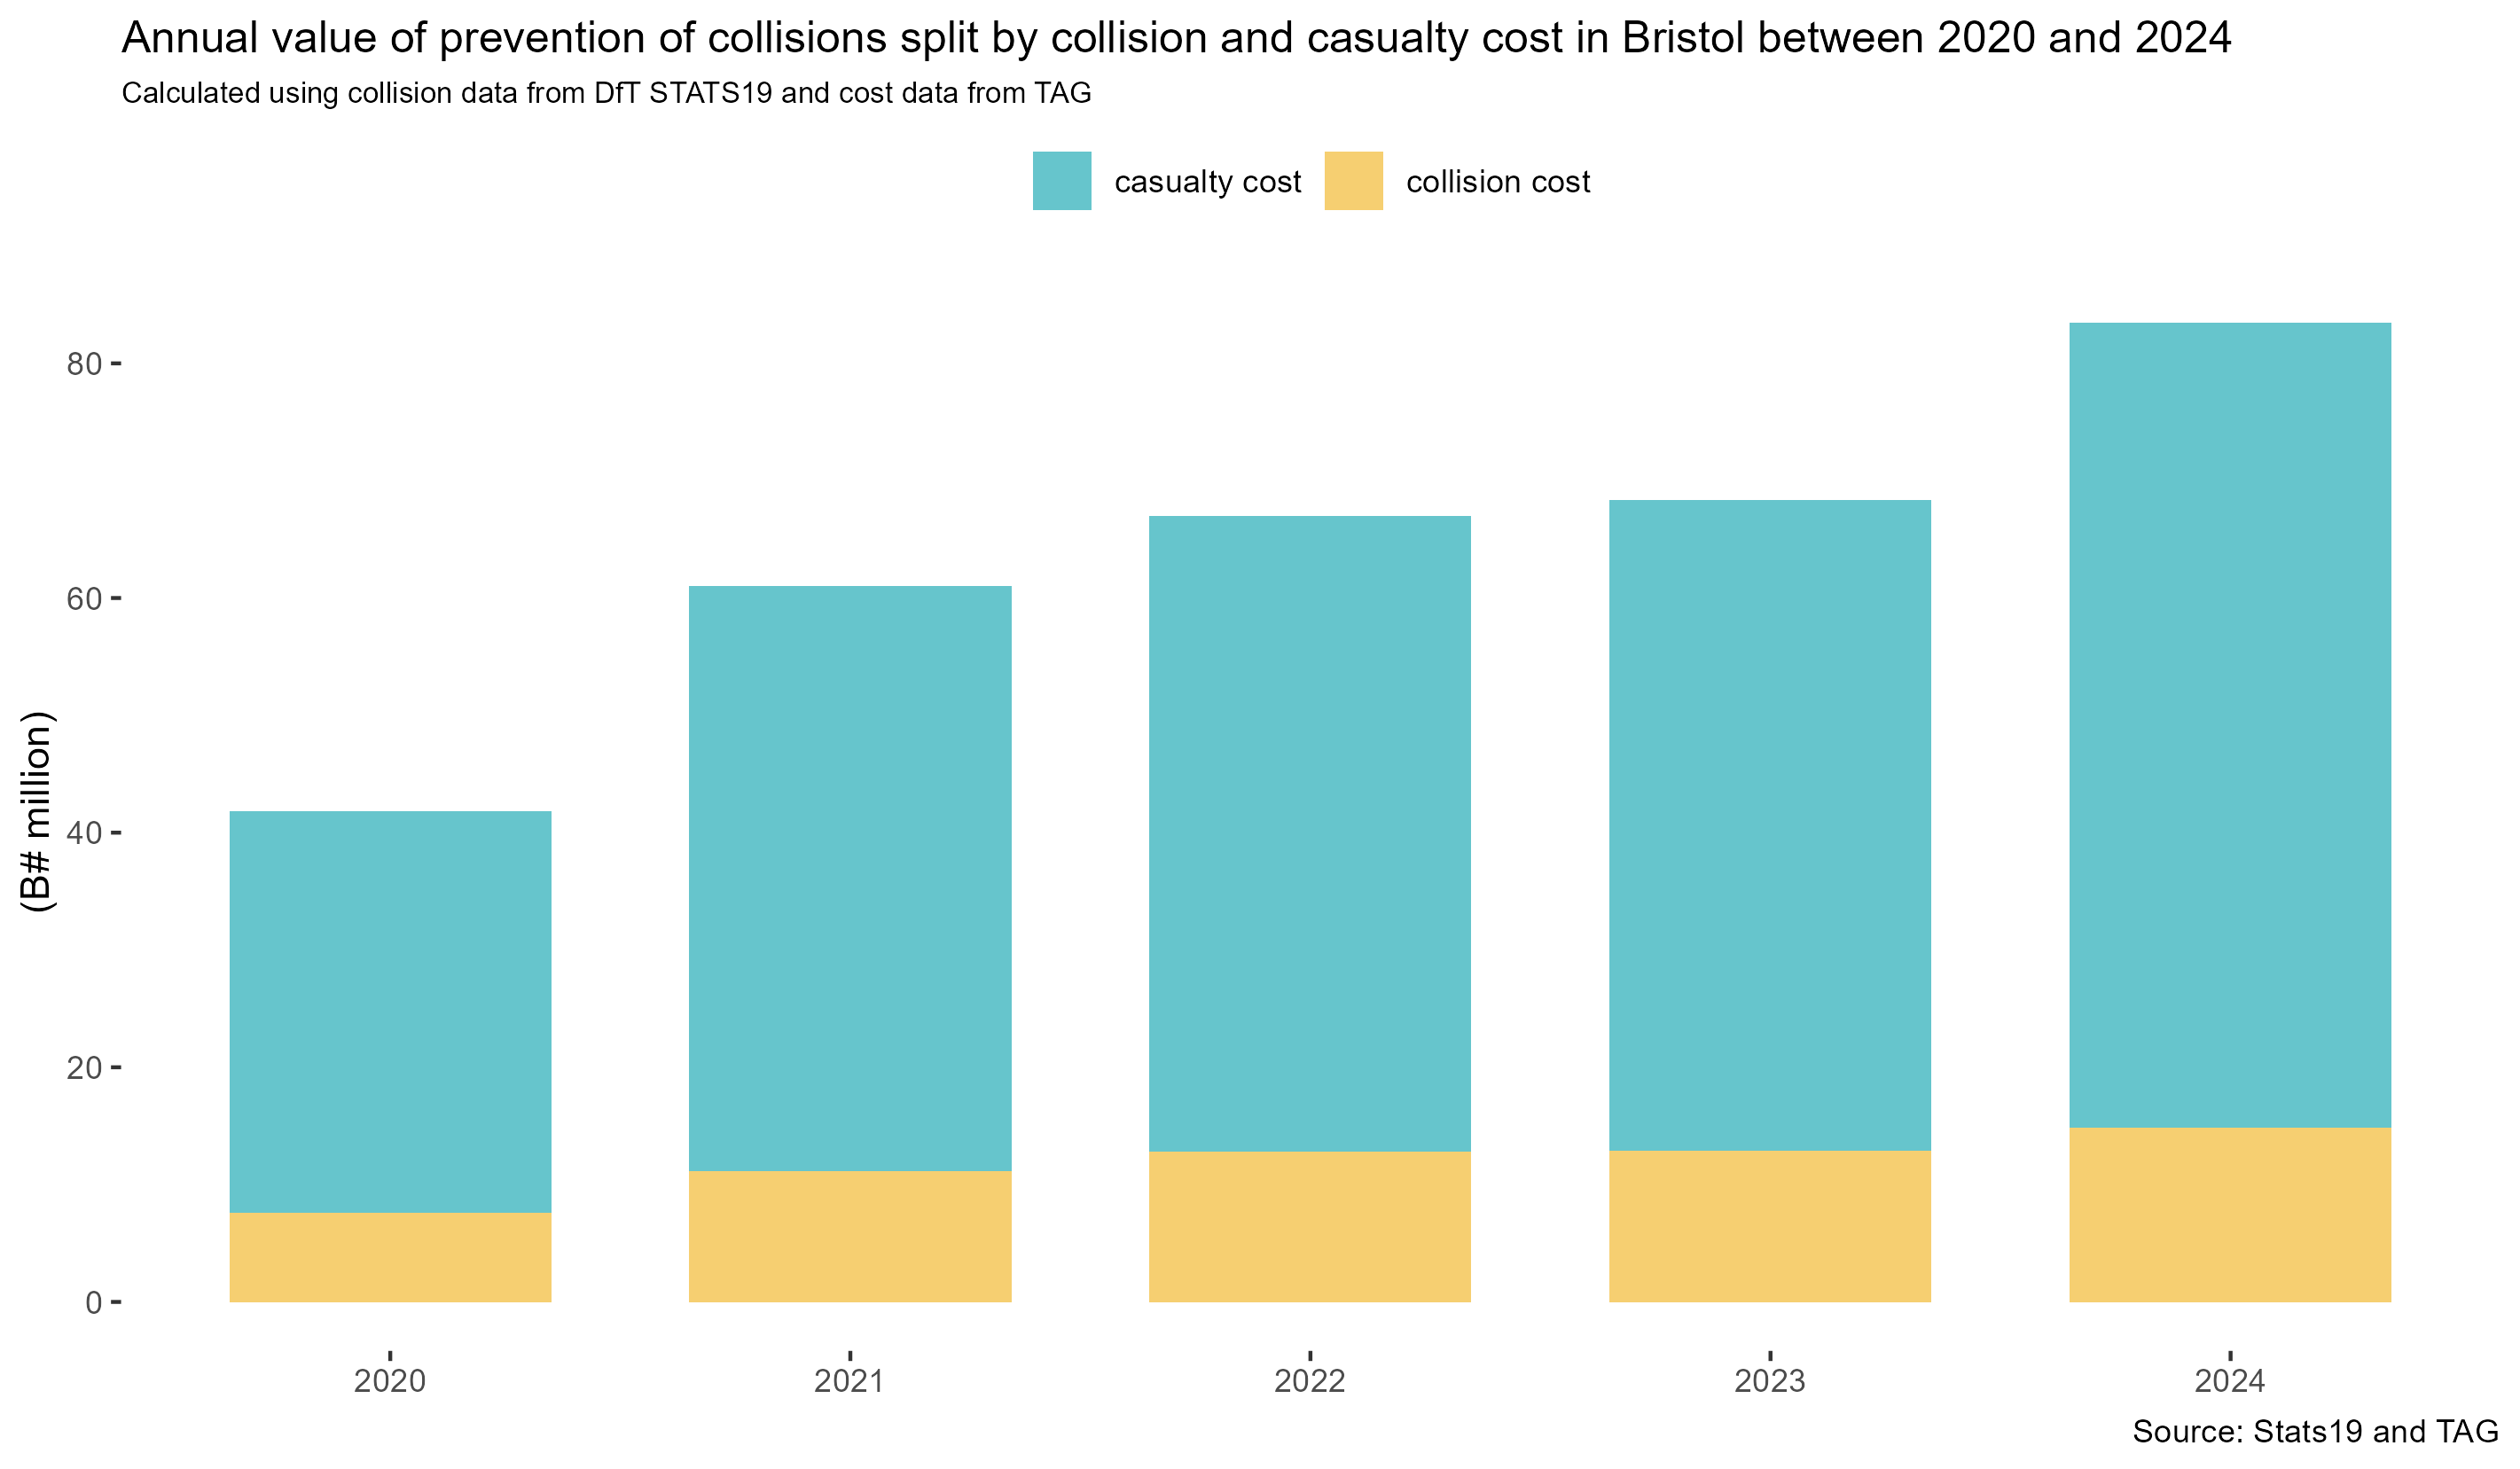
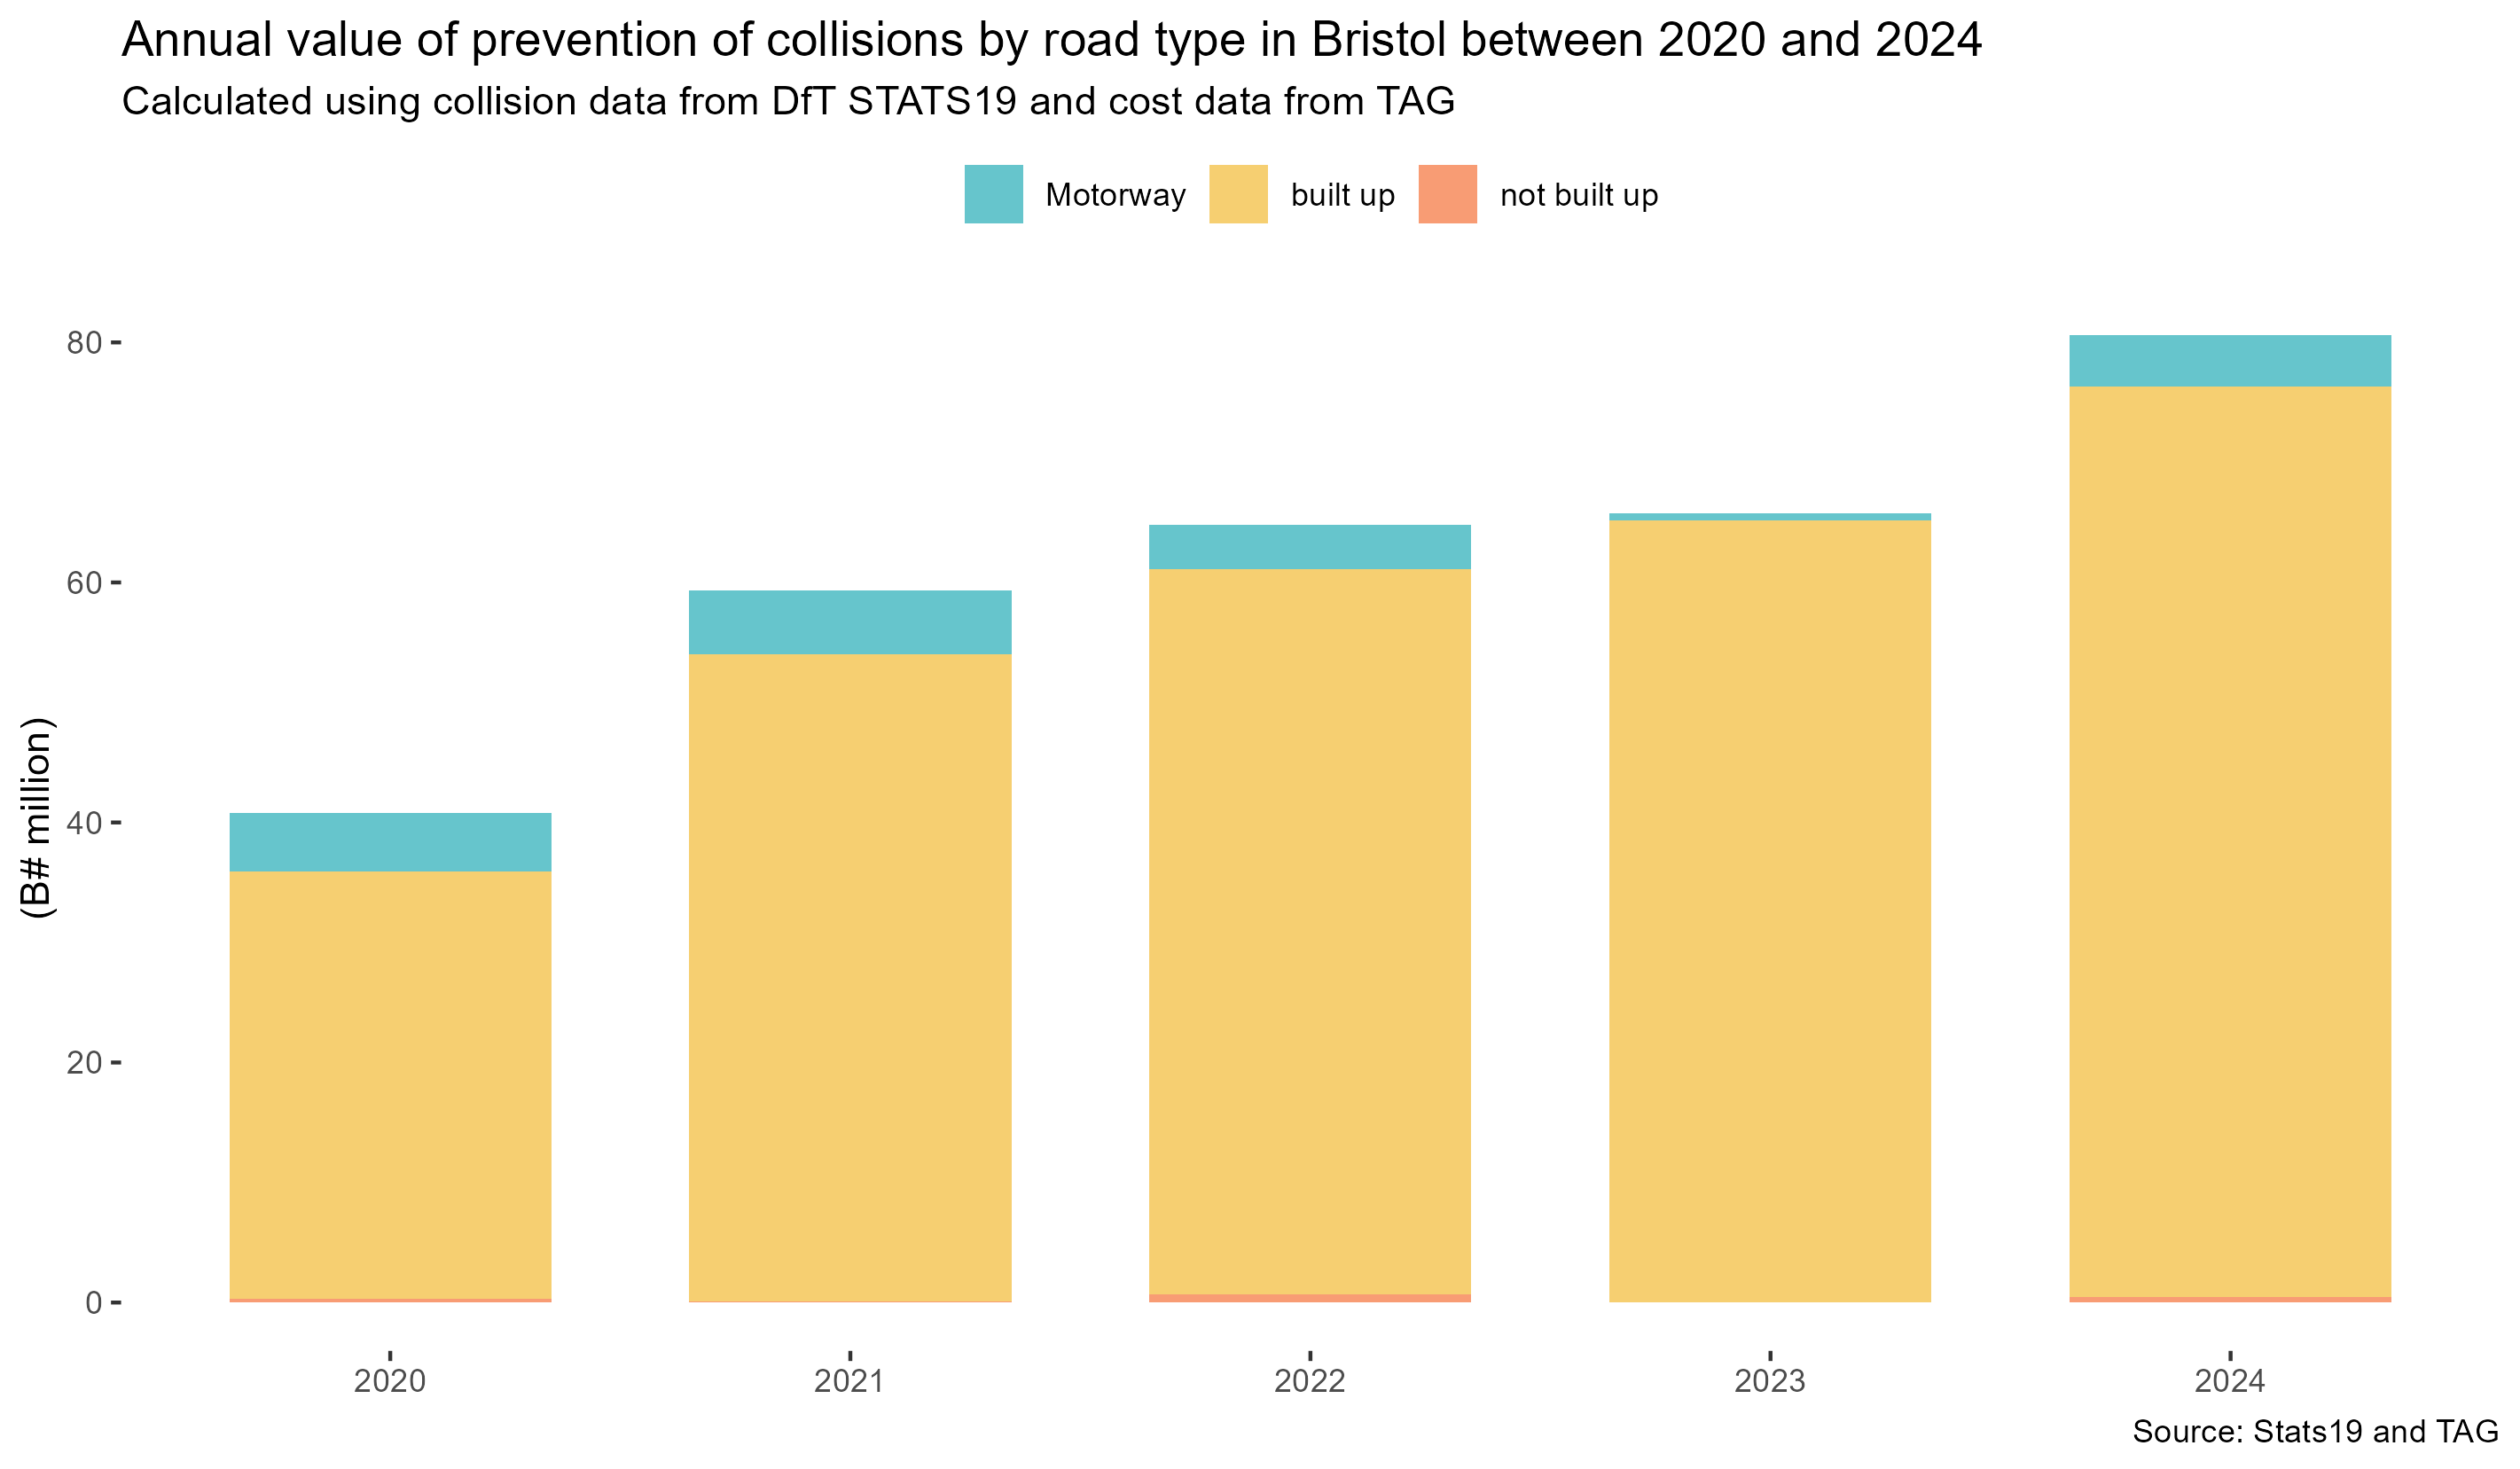
Government TAG methodology (described here and here allocates a cost of prevention to each collision. The costs are calculated initially based on casualty severity and then grouped by collision severity. For example, the cost of fatal collisions includes the cost of all casualties (including serious and slight casualties) that occur in fatal collisions. This can be matched in various ways to the collision data. The two methods used for the overall reporting in ONS is to simply match the collision severity recorded in the crash data to a single cost for slight, serious and fatal and also to match based on severity and road type. Using the same methods as in the ONS report, the chart below shows the total cost of prevention for the collisions Bristol.
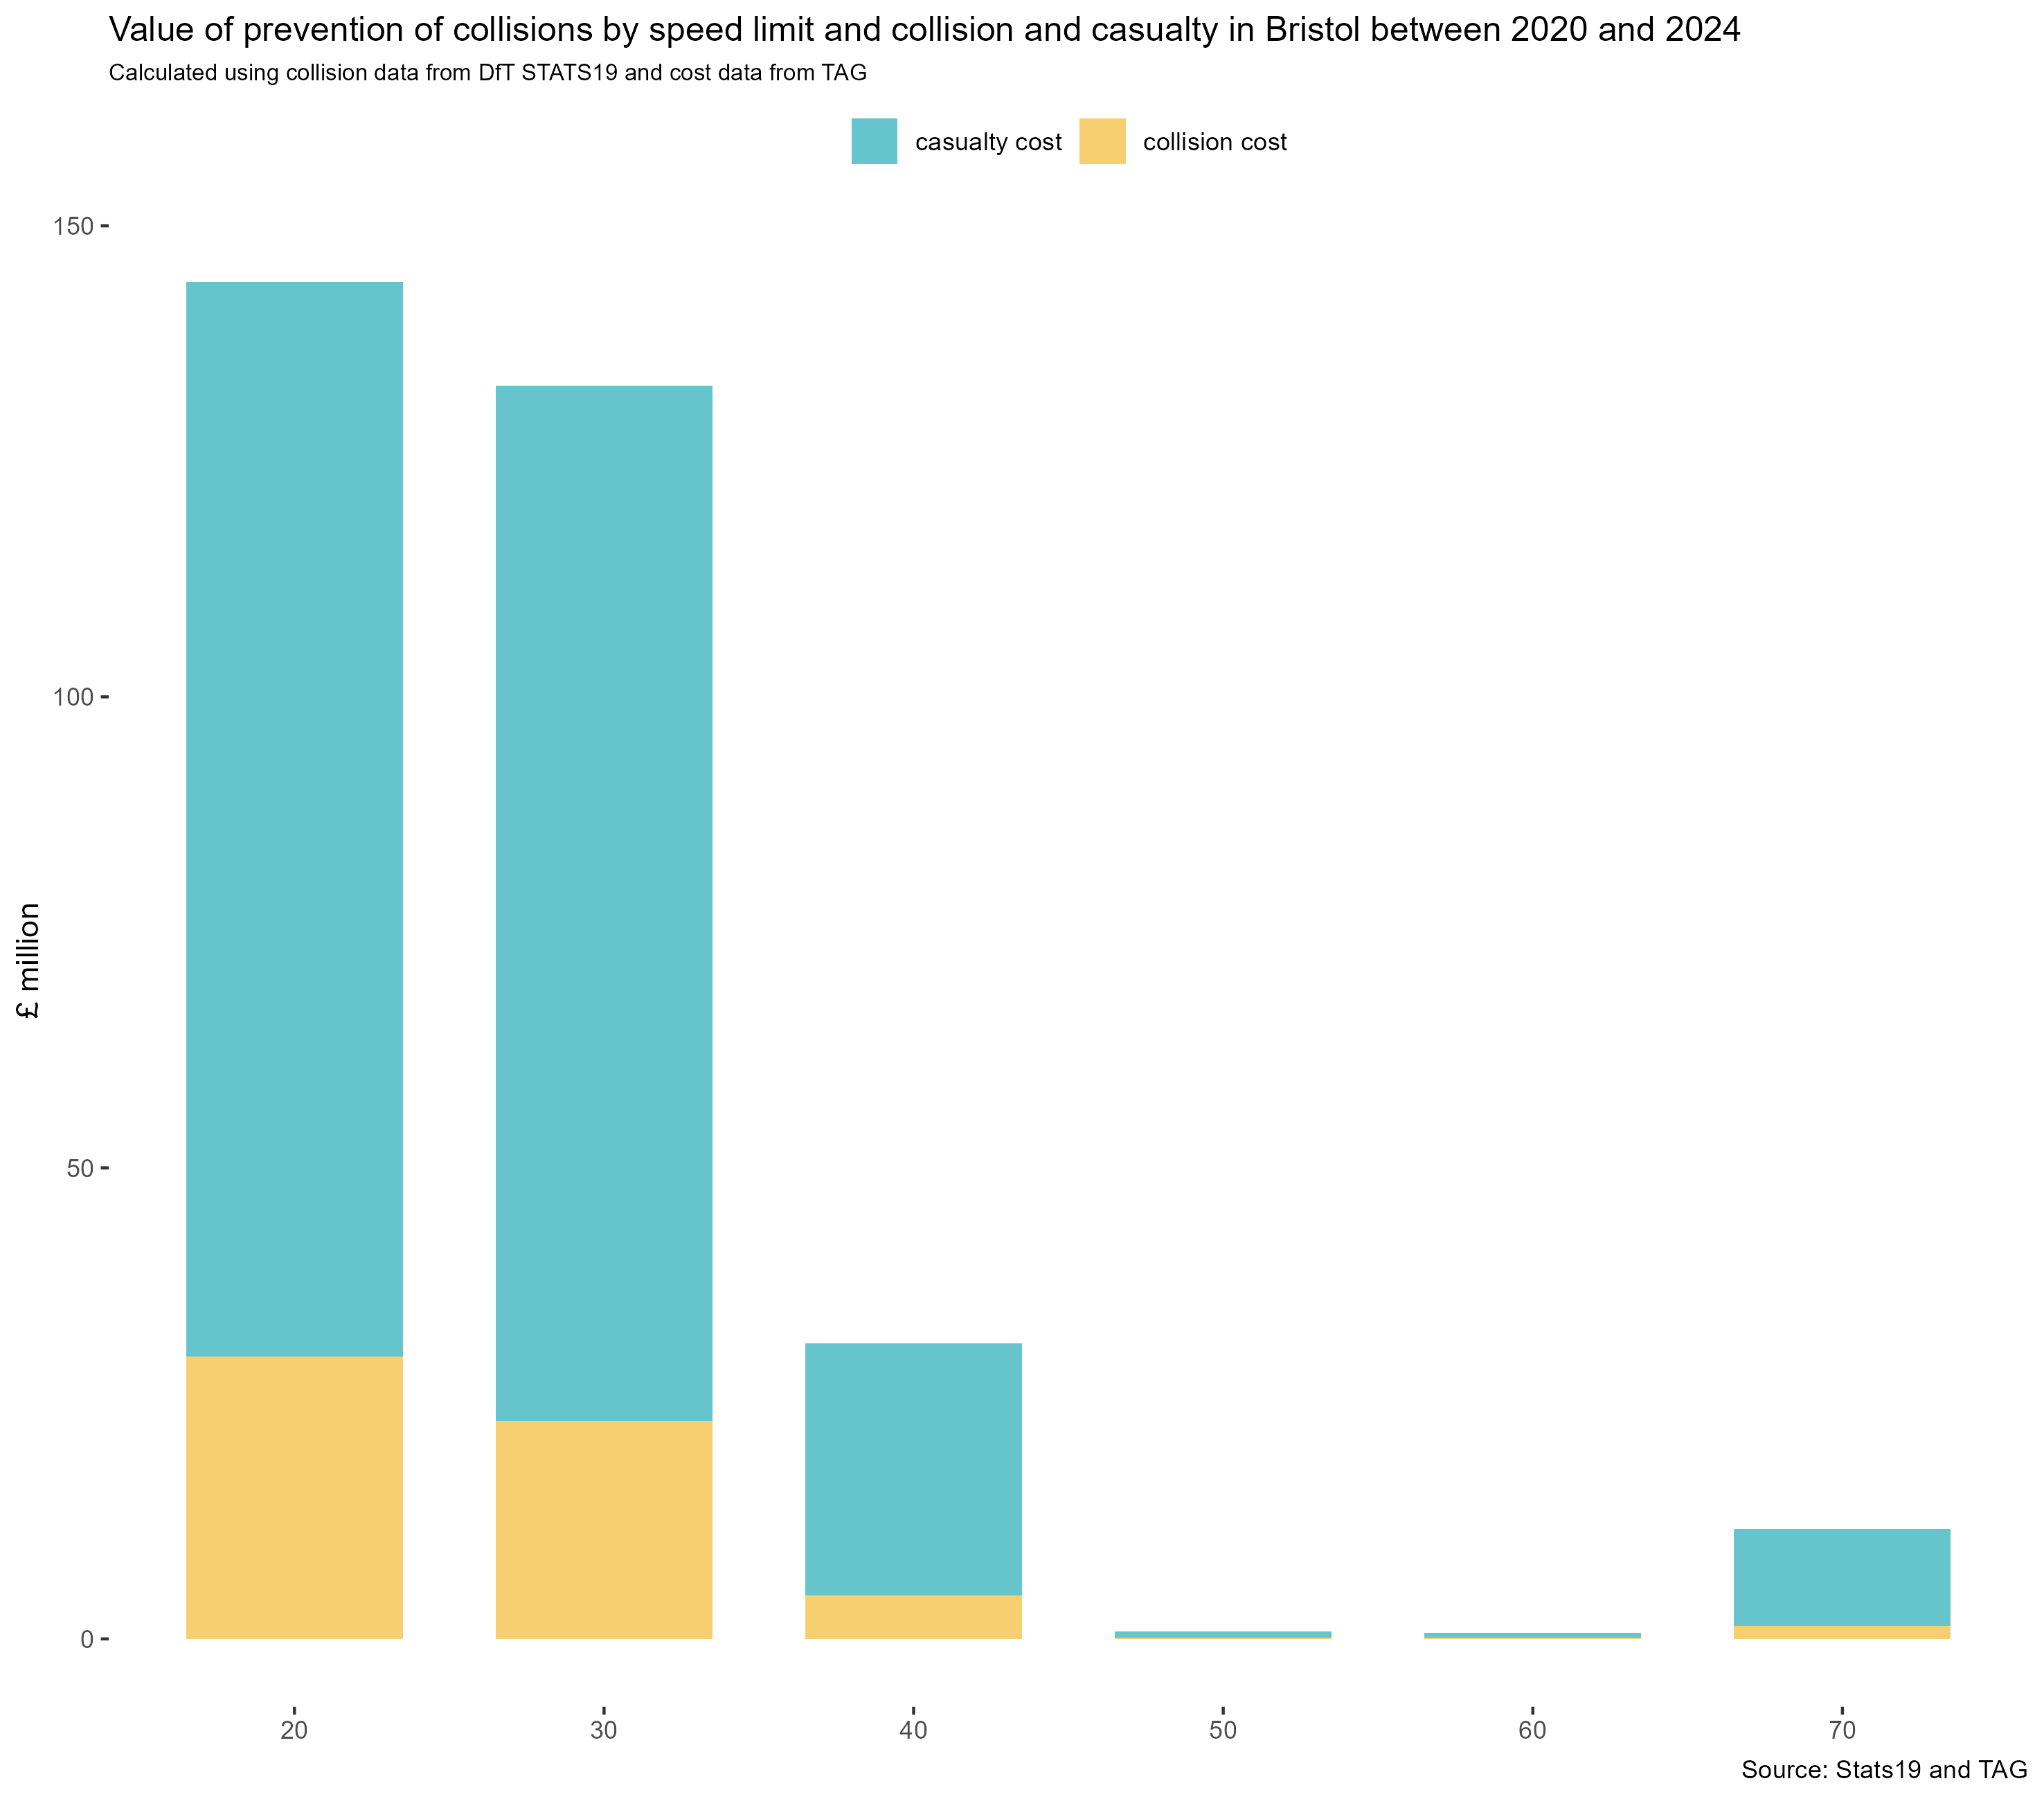
The cost of collisions by vehicle involved and by speed limit are shown in the plot below. 20mph roads had the highest total cost with £144,070,313, 8.3% above 30mph. The lowest total cost were 60mph with £663,219
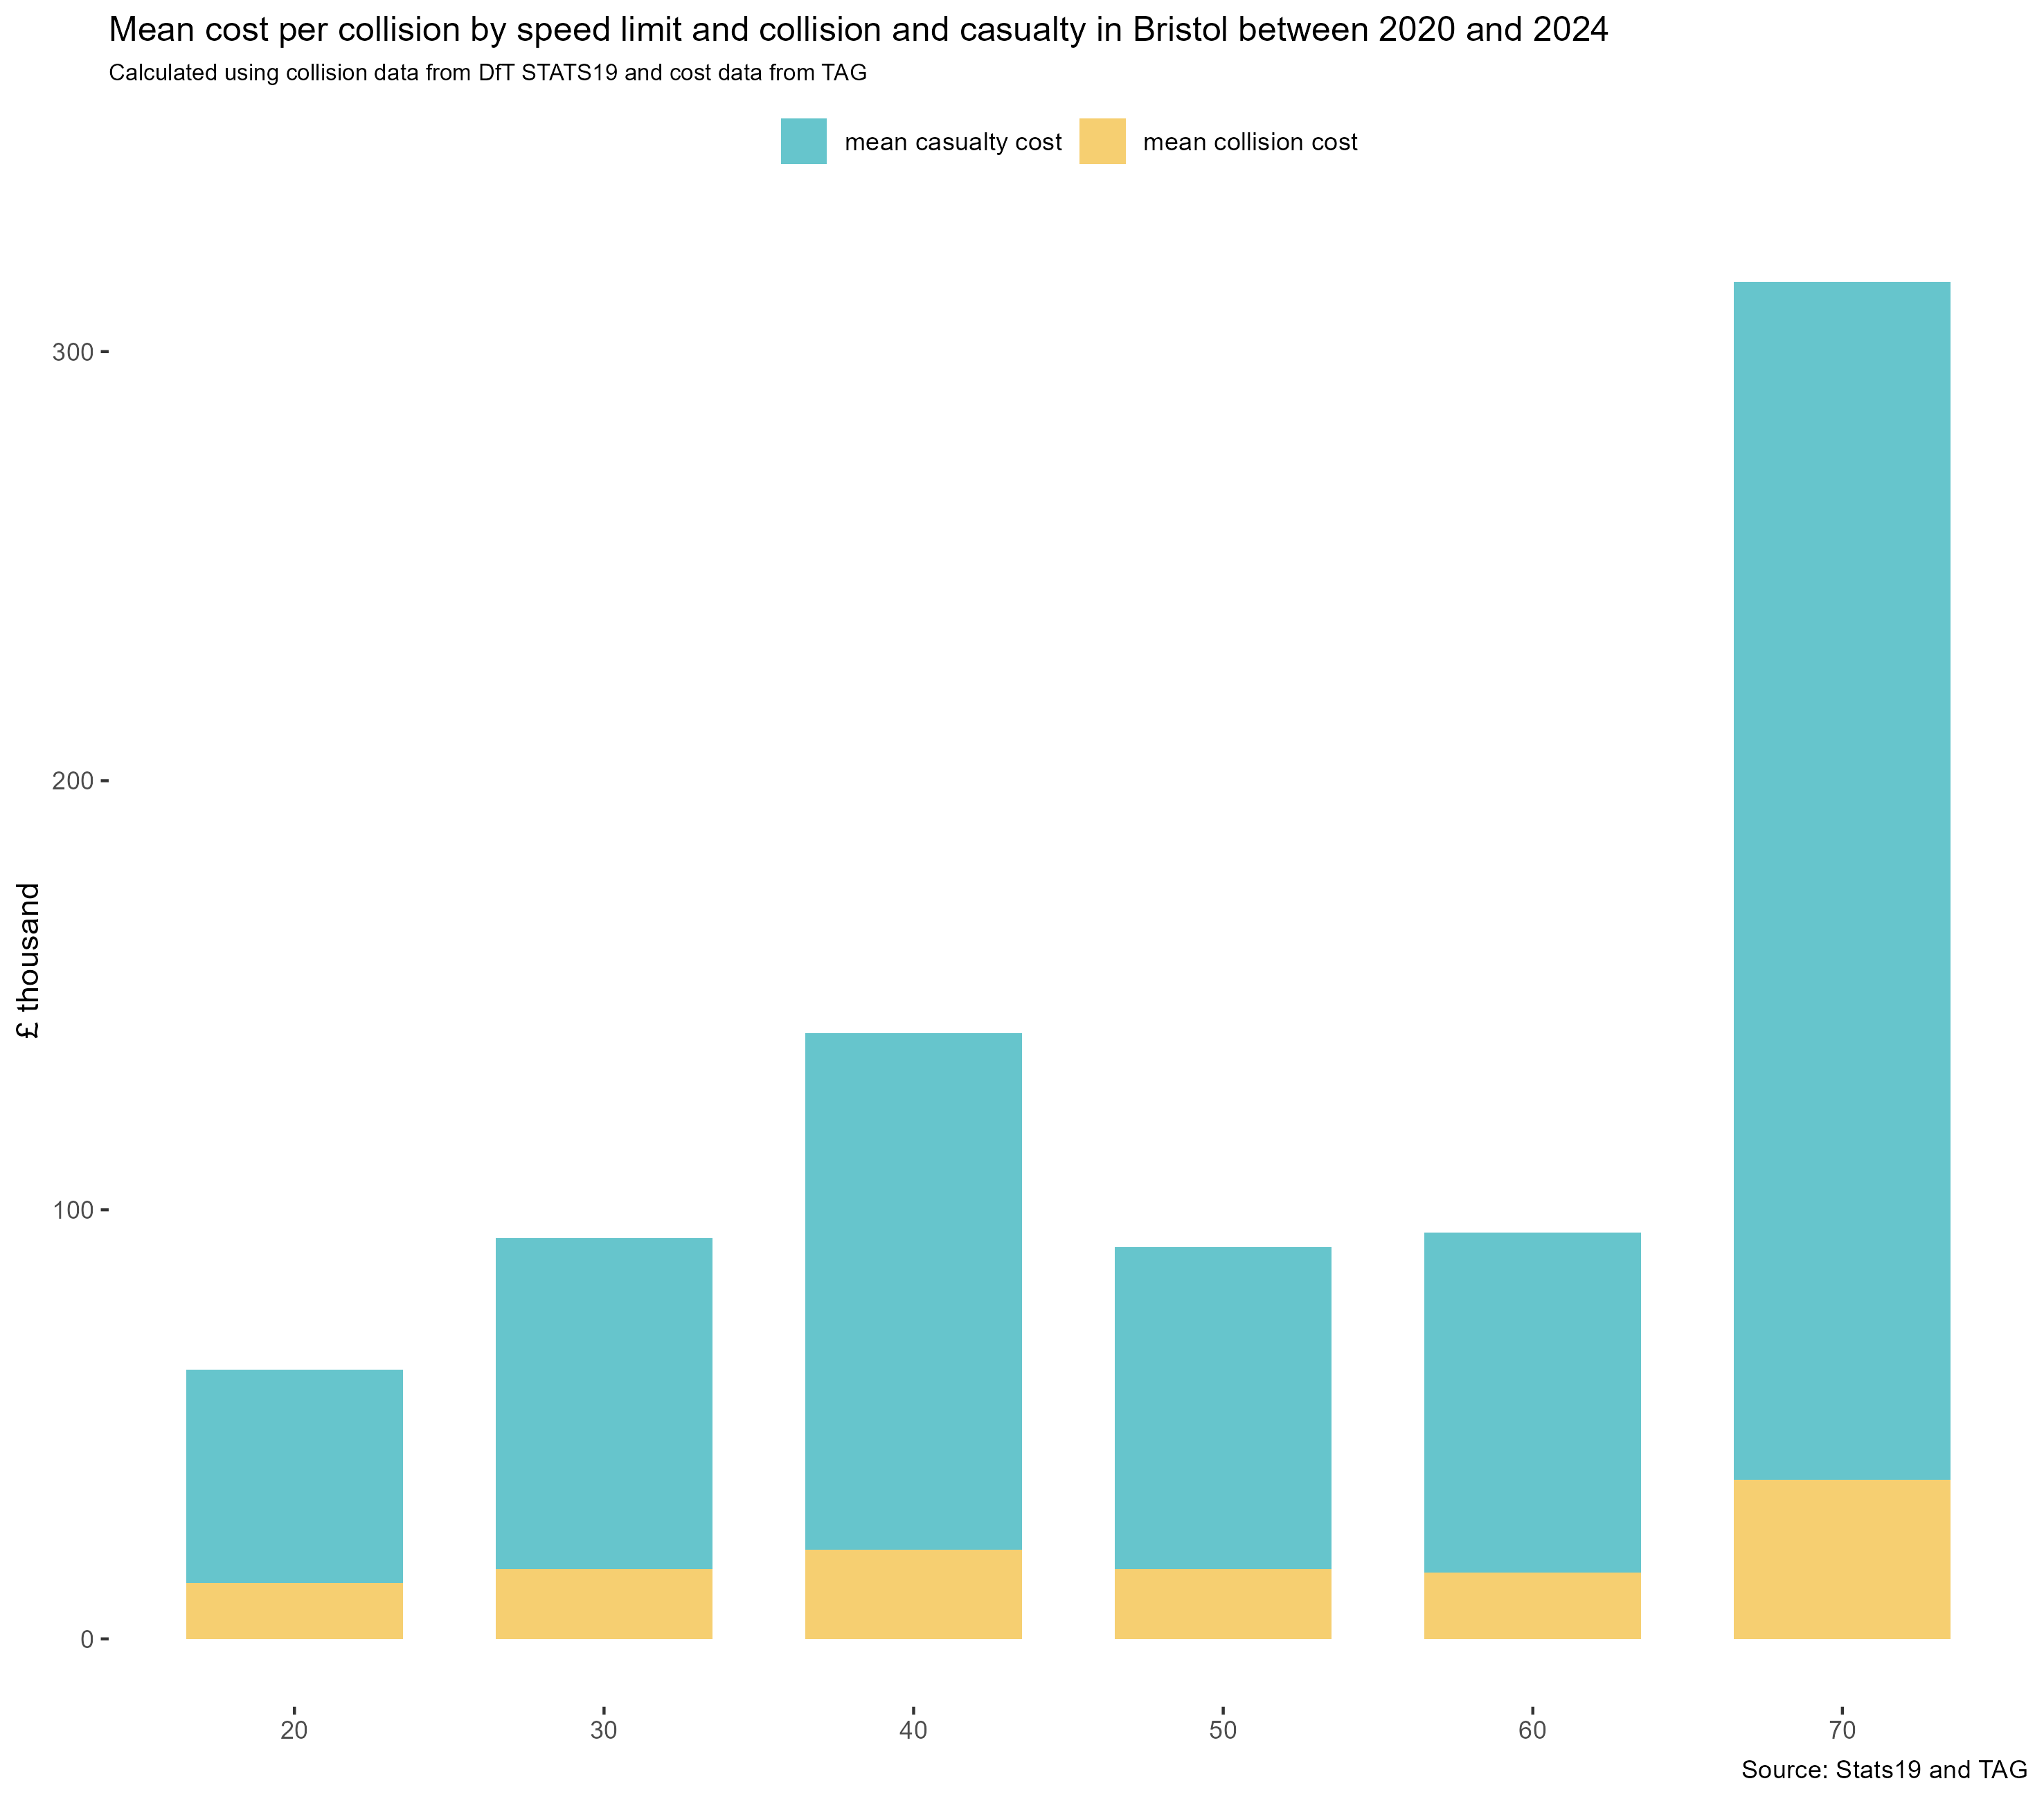
Dividing the total cost on each road by the number of collisions gives an estimate for the average cost of each collision on each road. The lowest (£62,776) were 20mph roads and the highest (£316,296) 70mph roads. 57% of total collisions took place on 20mph roads, but 45% of the total cost and 70mph roads had 1% of total collisions but 4% of the total cost. The cost of collisions on 70mph roads are, on average, 5 times higher than 20mph roads. The average cost of collisions on 30mph roads was 1.5 times higher than 20mph roads.
Single Vehicle Pavement Collisions
Between 2020 and 2024, nationally there were 9327 single-vehicle collisions where a pedestrian was struck on a footway or verge. 81% were people driving Cars, Taxis, Goods vehicles and Buses and 12% were people riding pedal cycles and e-scooters. Of these collisions there were 138 fatalities, 94% of these fatal collisions were with people driving Cars, Taxis, Goods vehicles and Buses and 1% died from collisions with people riding pedal cycles and e-scooters. A further 2300 serious injuries, 79% of the fatal collisions were with people driving Cars, Taxis, Goods vehicles and Buses and 13% from collisions with people riding pedal cycles and e-scooters.
In Bristol there were 98 reported incidents, resulting in 103 casualties. The vehicle type most commonly involved was Car with 40 collisions and 43 casualties. 64% of the vehicles in collisions were people driving Cars, Taxis, Goods vehicles and Buses and 31% were people riding pedal cycles and escooters. Of these collisions there were 3 fatalities, 100% of these collisions were with people driving Cars, Taxis, Goods vehicles and Buses and 0% from collisions with people riding pedal cycles and e-scooters. A further 12 serious injuries, 75% of which were with people driving Cars, Taxis, Goods vehicles and Buses and 25% from collisions with people riding pedal cycles and e-scooters. The plot below is meant to visually represent a pavement with squares for all the KSI casualties in Bristol coloured by the vehicle that hit them.

Appendix
Casualty type categorisation.
| Table showing casualty groupings used in report | |
| STATS19 Name | Catagorised |
|---|---|
| Car occupant | Car occupant |
| Motorcycle 125cc and under rider or passenger | Motorcyclist |
| Cyclist | Cyclist |
| Pedestrian | Pedestrian |
| Motorcycle over 500cc rider or passenger | Motorcyclist |
| Motorcycle over 125cc and up to 500cc rider or passenger | Motorcyclist |
| Motorcycle 50cc and under rider or passenger | Motorcyclist |
| Bus or coach occupant (17 or more pass seats) | Bus occupant |
| Taxi/Private hire car occupant | Taxi occupant |
| Van / Goods vehicle (3.5 tonnes mgw or under) occupant | Goods vehicle occupant |
| Other vehicle occupant | Other vehicle |
| Data missing or out of range | Data missing |
| Motorcycle - unknown cc rider or passenger | Motorcyclist |
| Goods vehicle (7.5 tonnes mgw and over) occupant | Goods vehicle occupant |
| Electric motorcycle rider or passenger | Motorcyclist |
| Minibus (8 - 16 passenger seats) occupant | Bus occupant |
| Mobility scooter rider | Mobility scooter rider |
| Horse rider | Horse rider |
| Goods vehicle (over 3.5t. and under 7.5t.) occupant | Goods vehicle occupant |
| Goods vehicle (unknown weight) occupant | Goods vehicle occupant |
| Agricultural vehicle occupant | Agricultural vehicle occupant |
| E-scooter rider | E-scooter rider |