Barcelona AQ and Cycle network
Piecing together some AQ and cycle network data for a Barcelona study trip.
Air Quality
There are 8 air quality sites in Barcelona monitoring NO2 and PM, the main vehicle pollutants of interest.
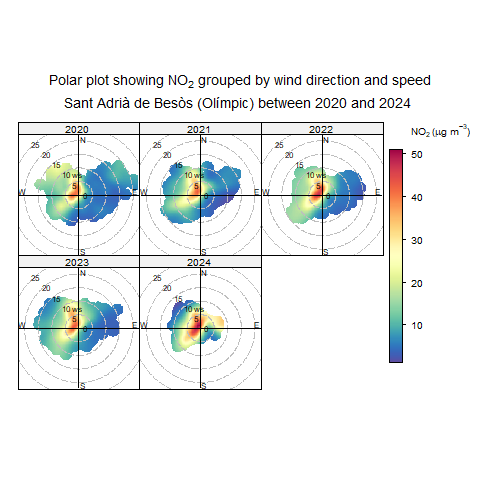
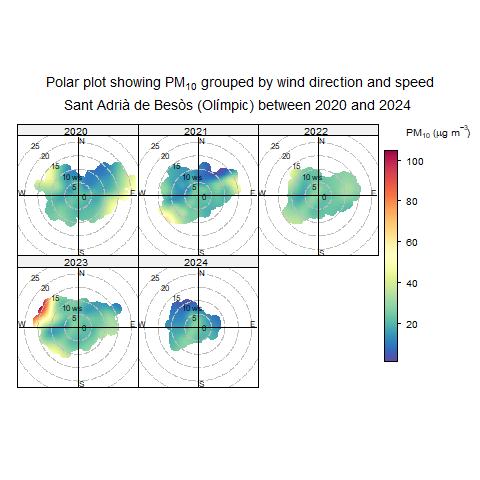
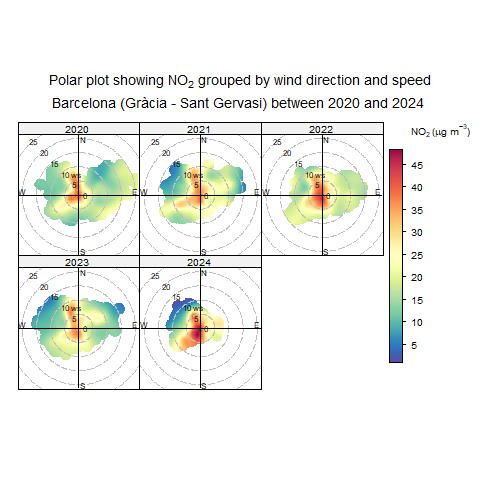
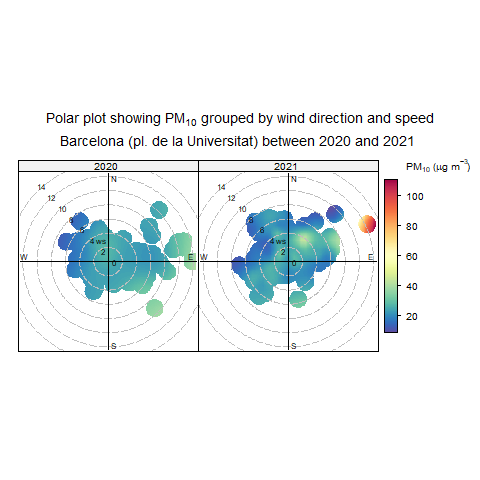
Two useful ways to use this data to gain insights into the effect of sources is to combine the data with wind speed and direction and do a “Polar Plot” from the openair R package. This essentially bins concentrations onto a compass and shows what combination of conditions had which concentrations.
This has been done for all sites and species as an average for the last 5 years on an interactive map
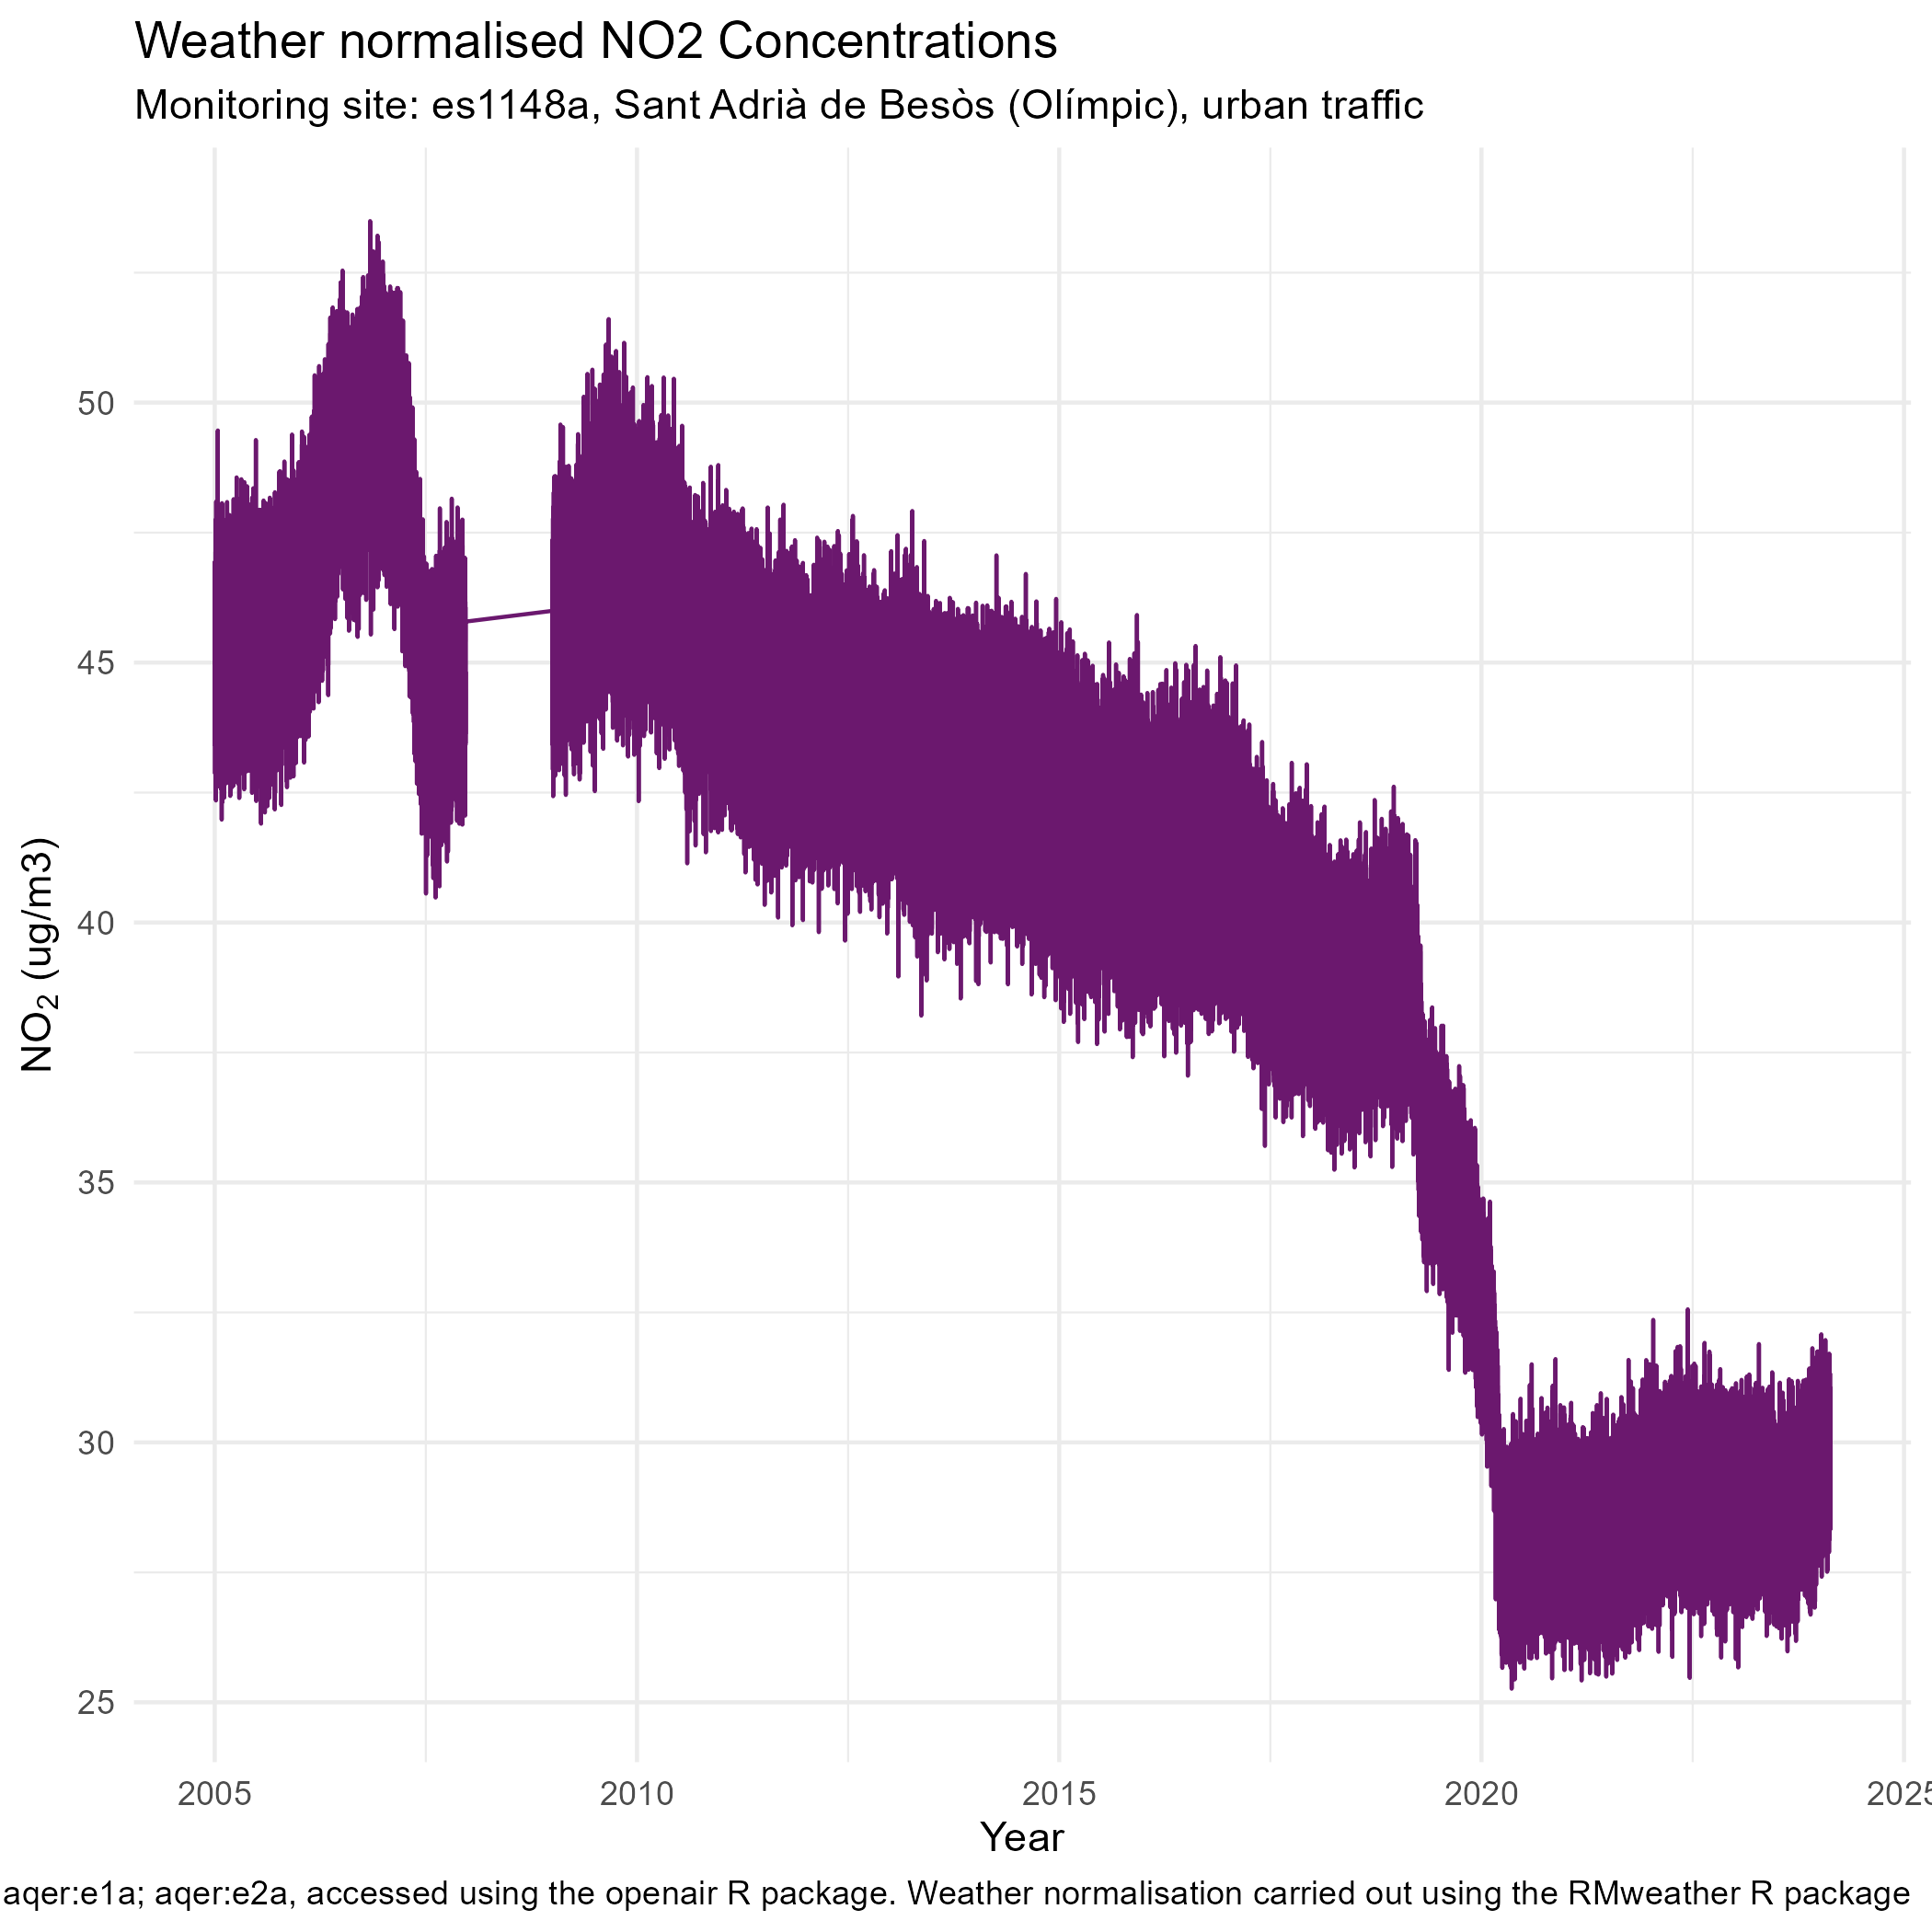
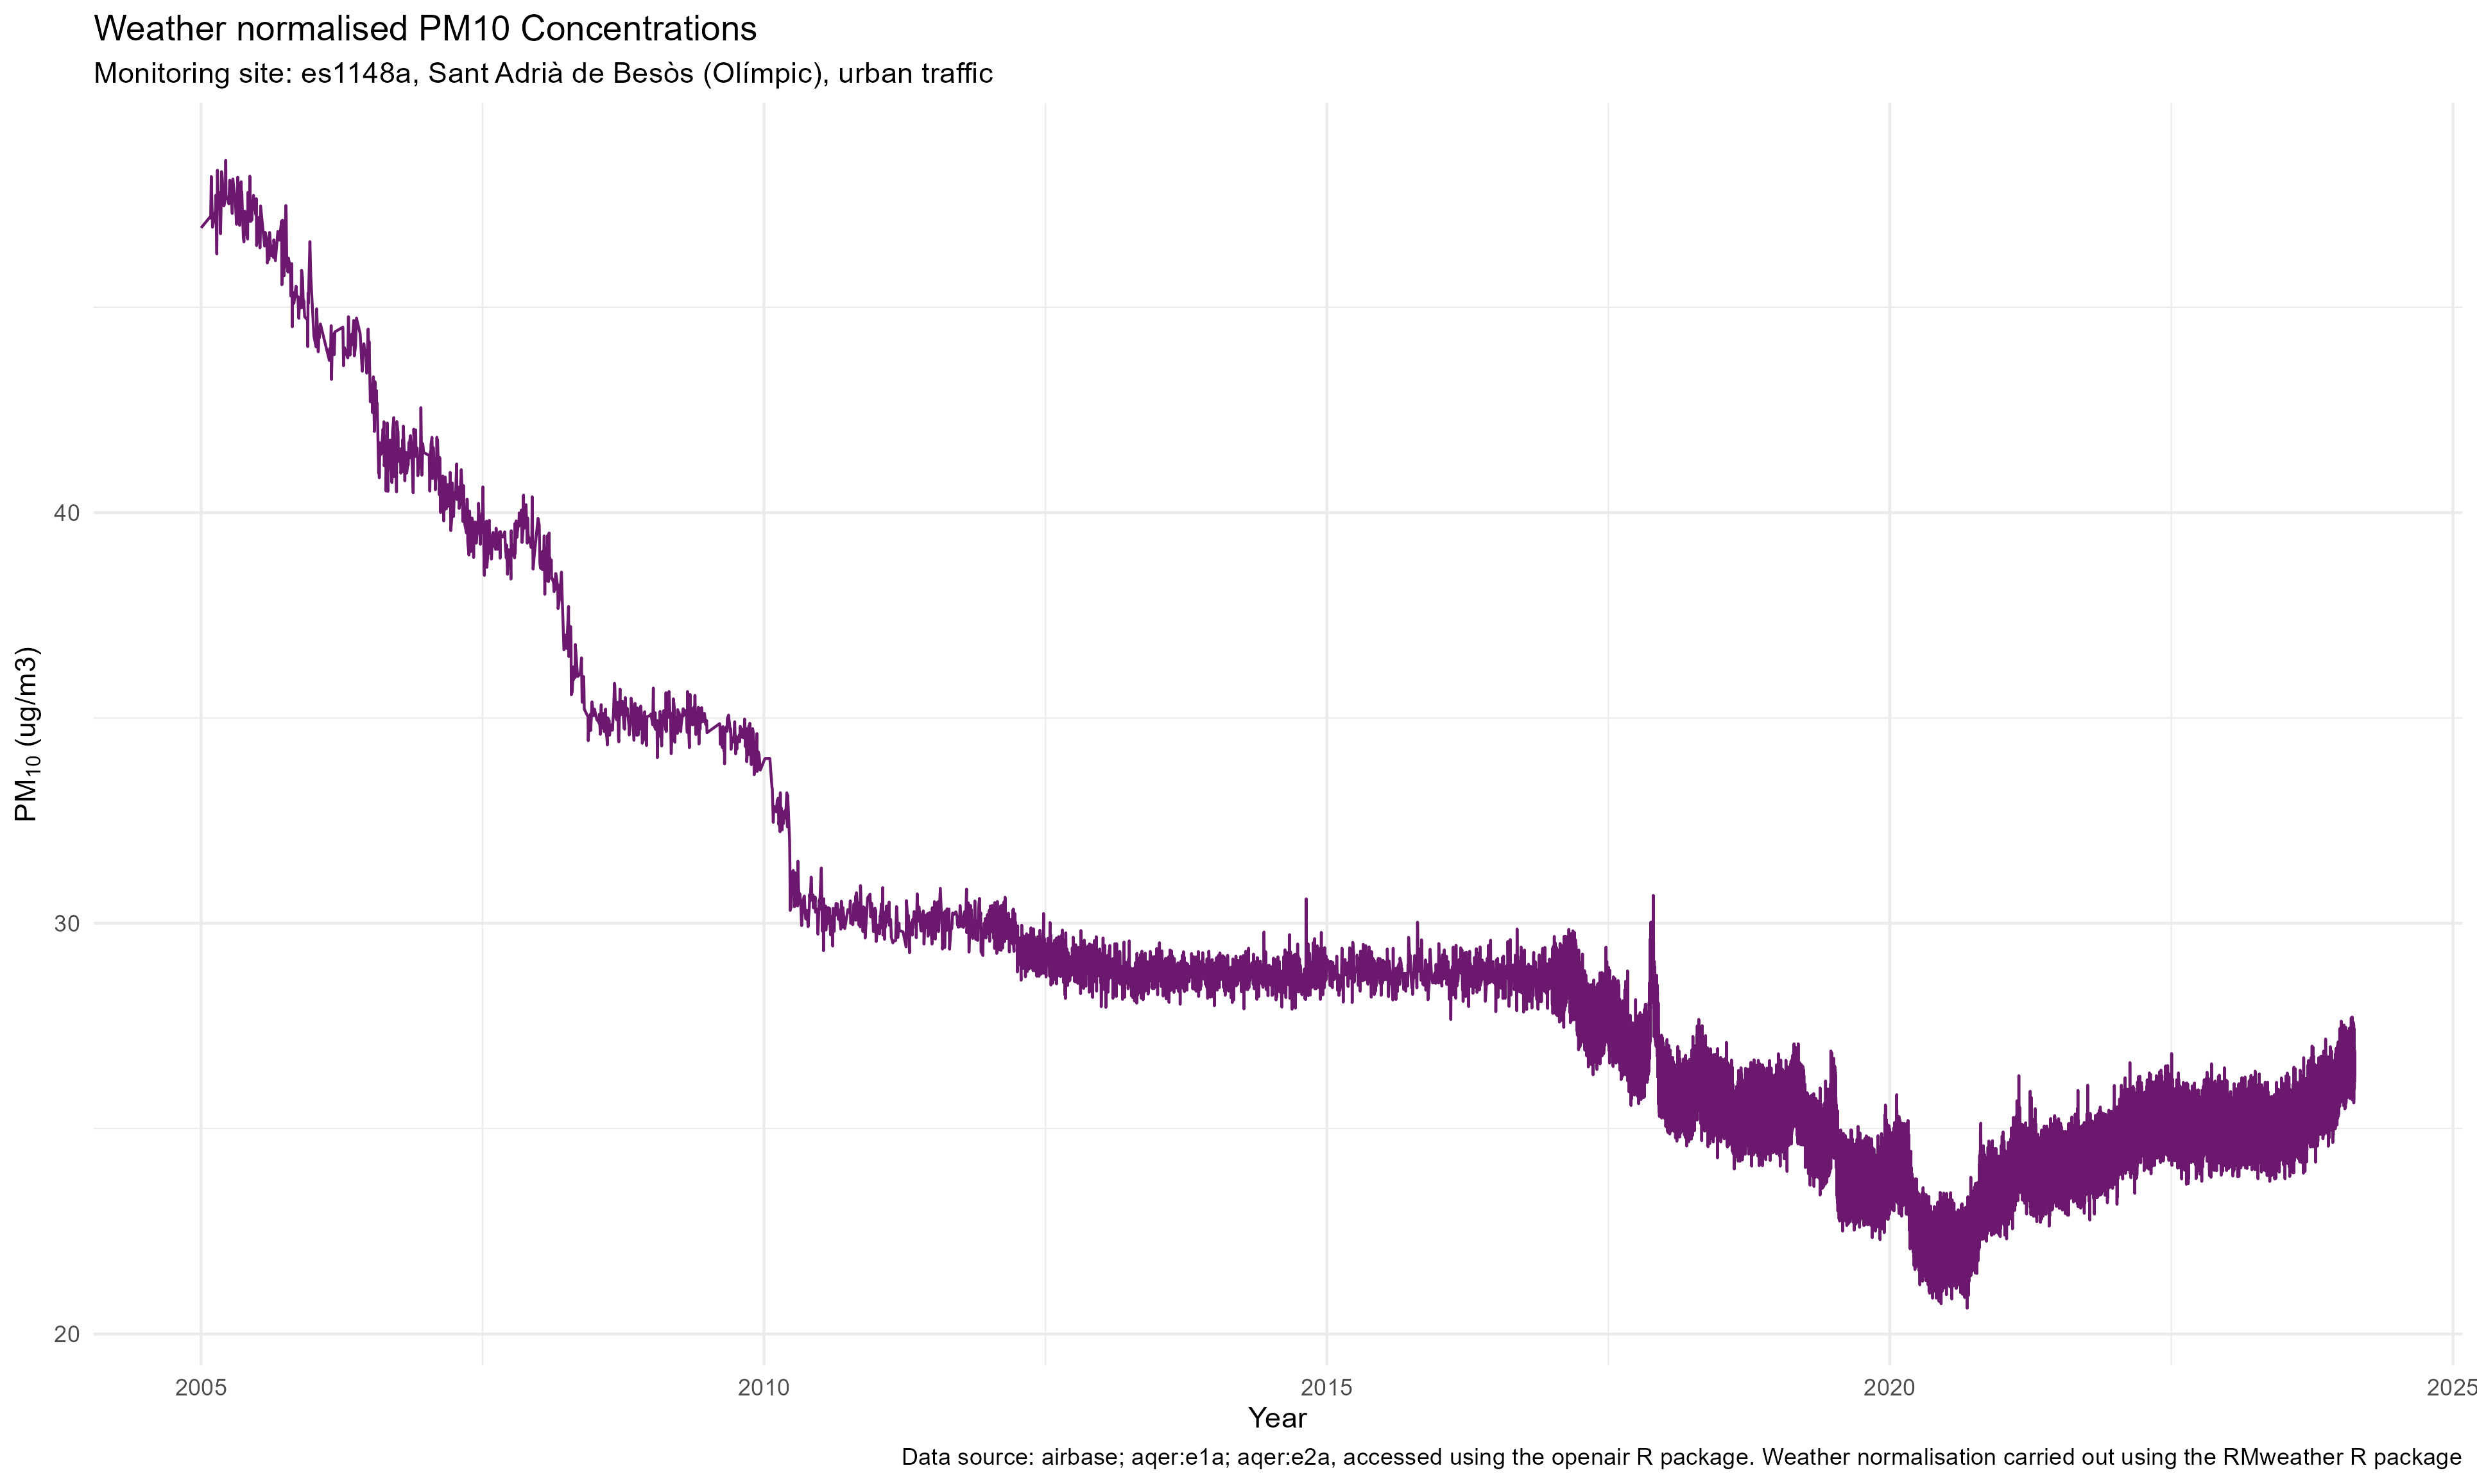
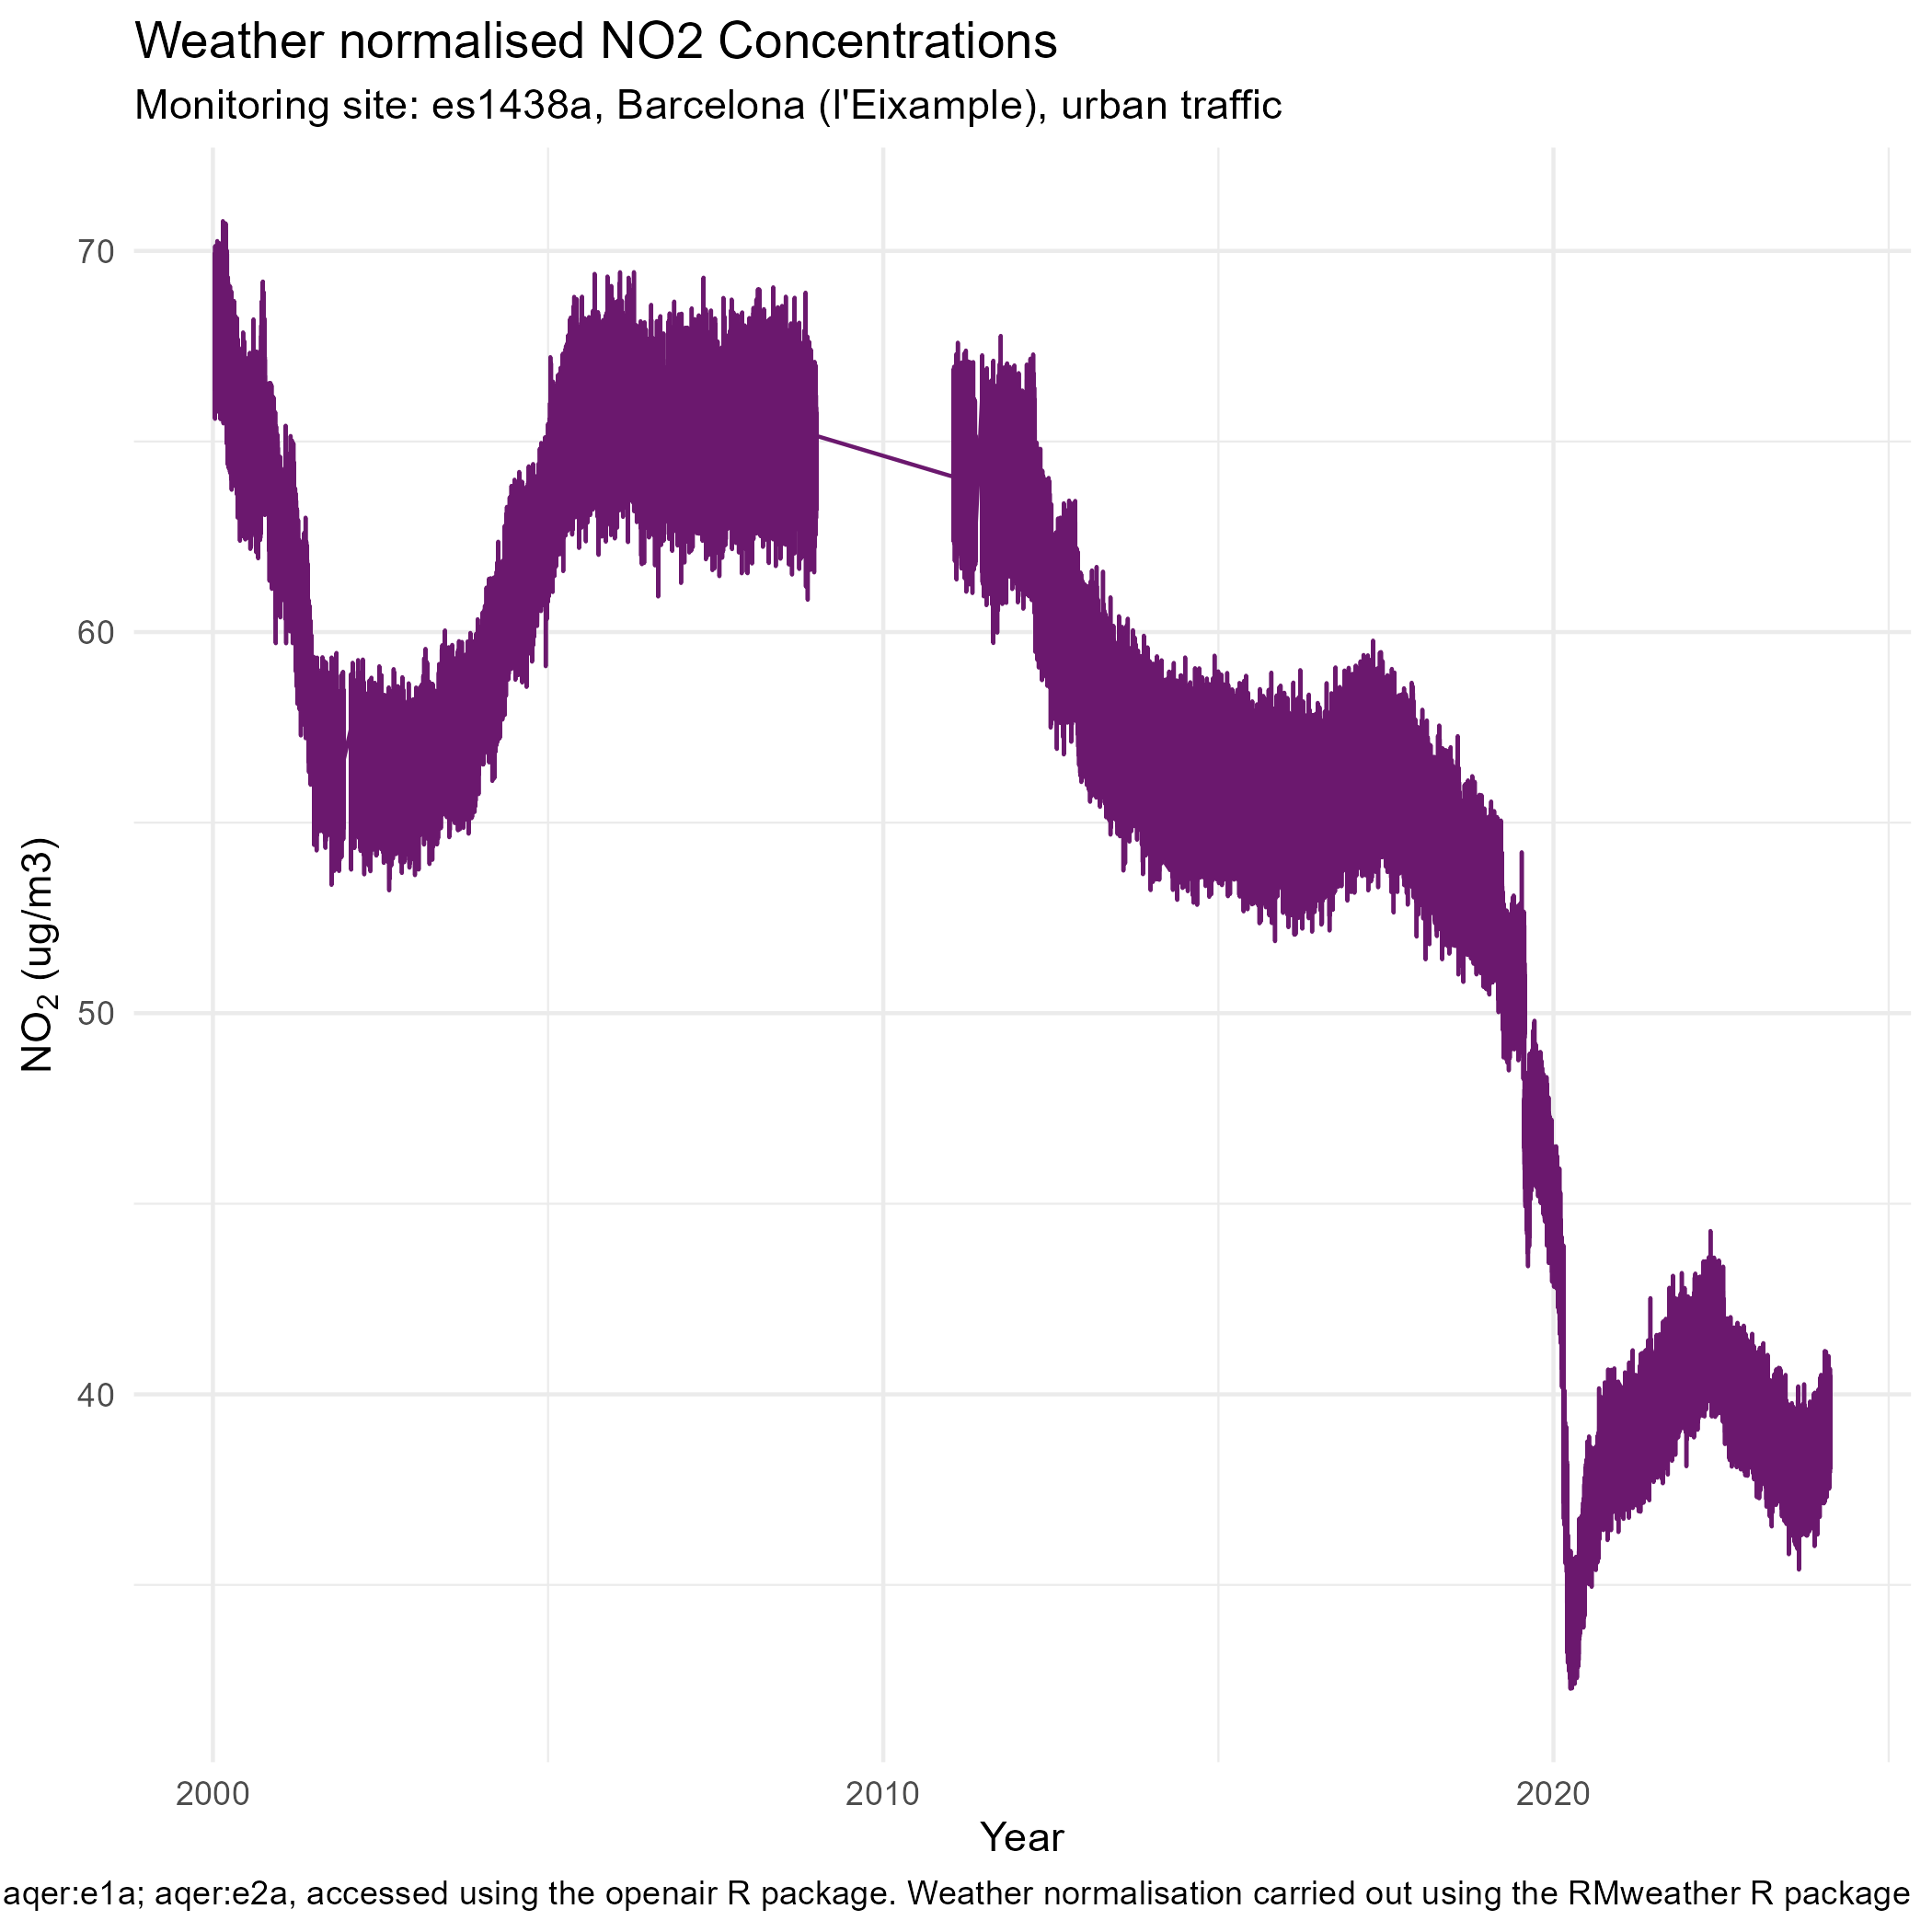
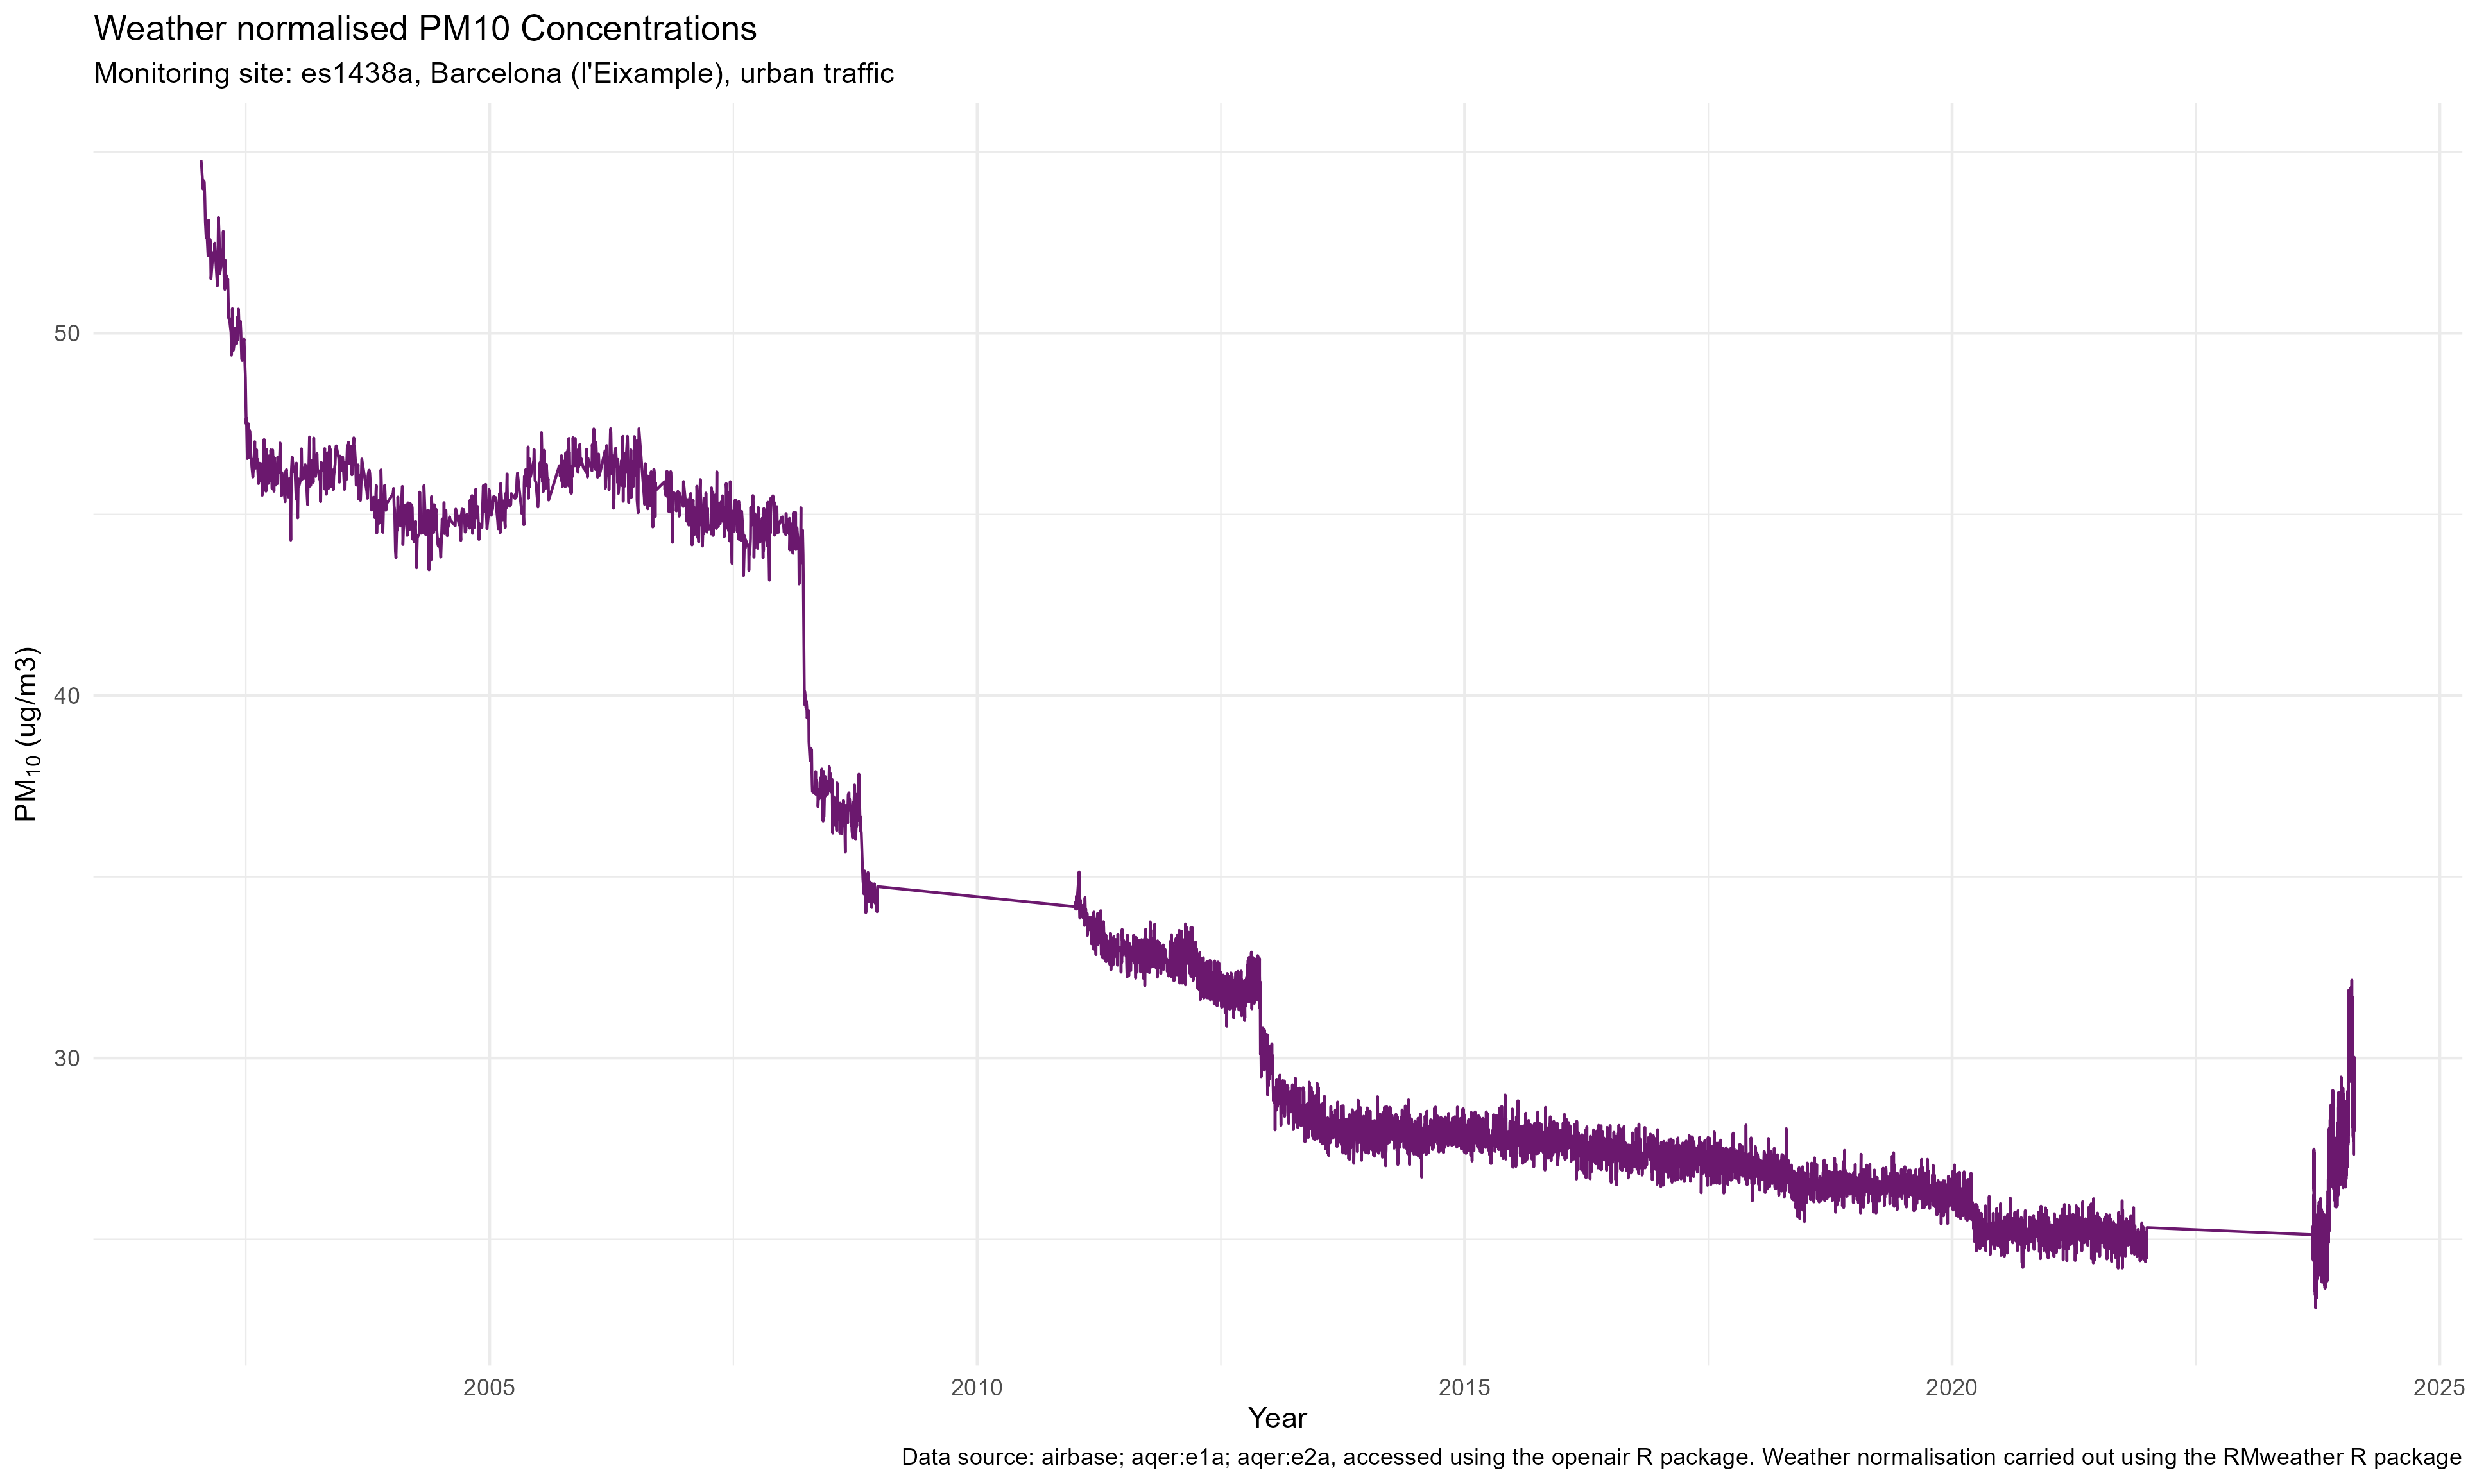
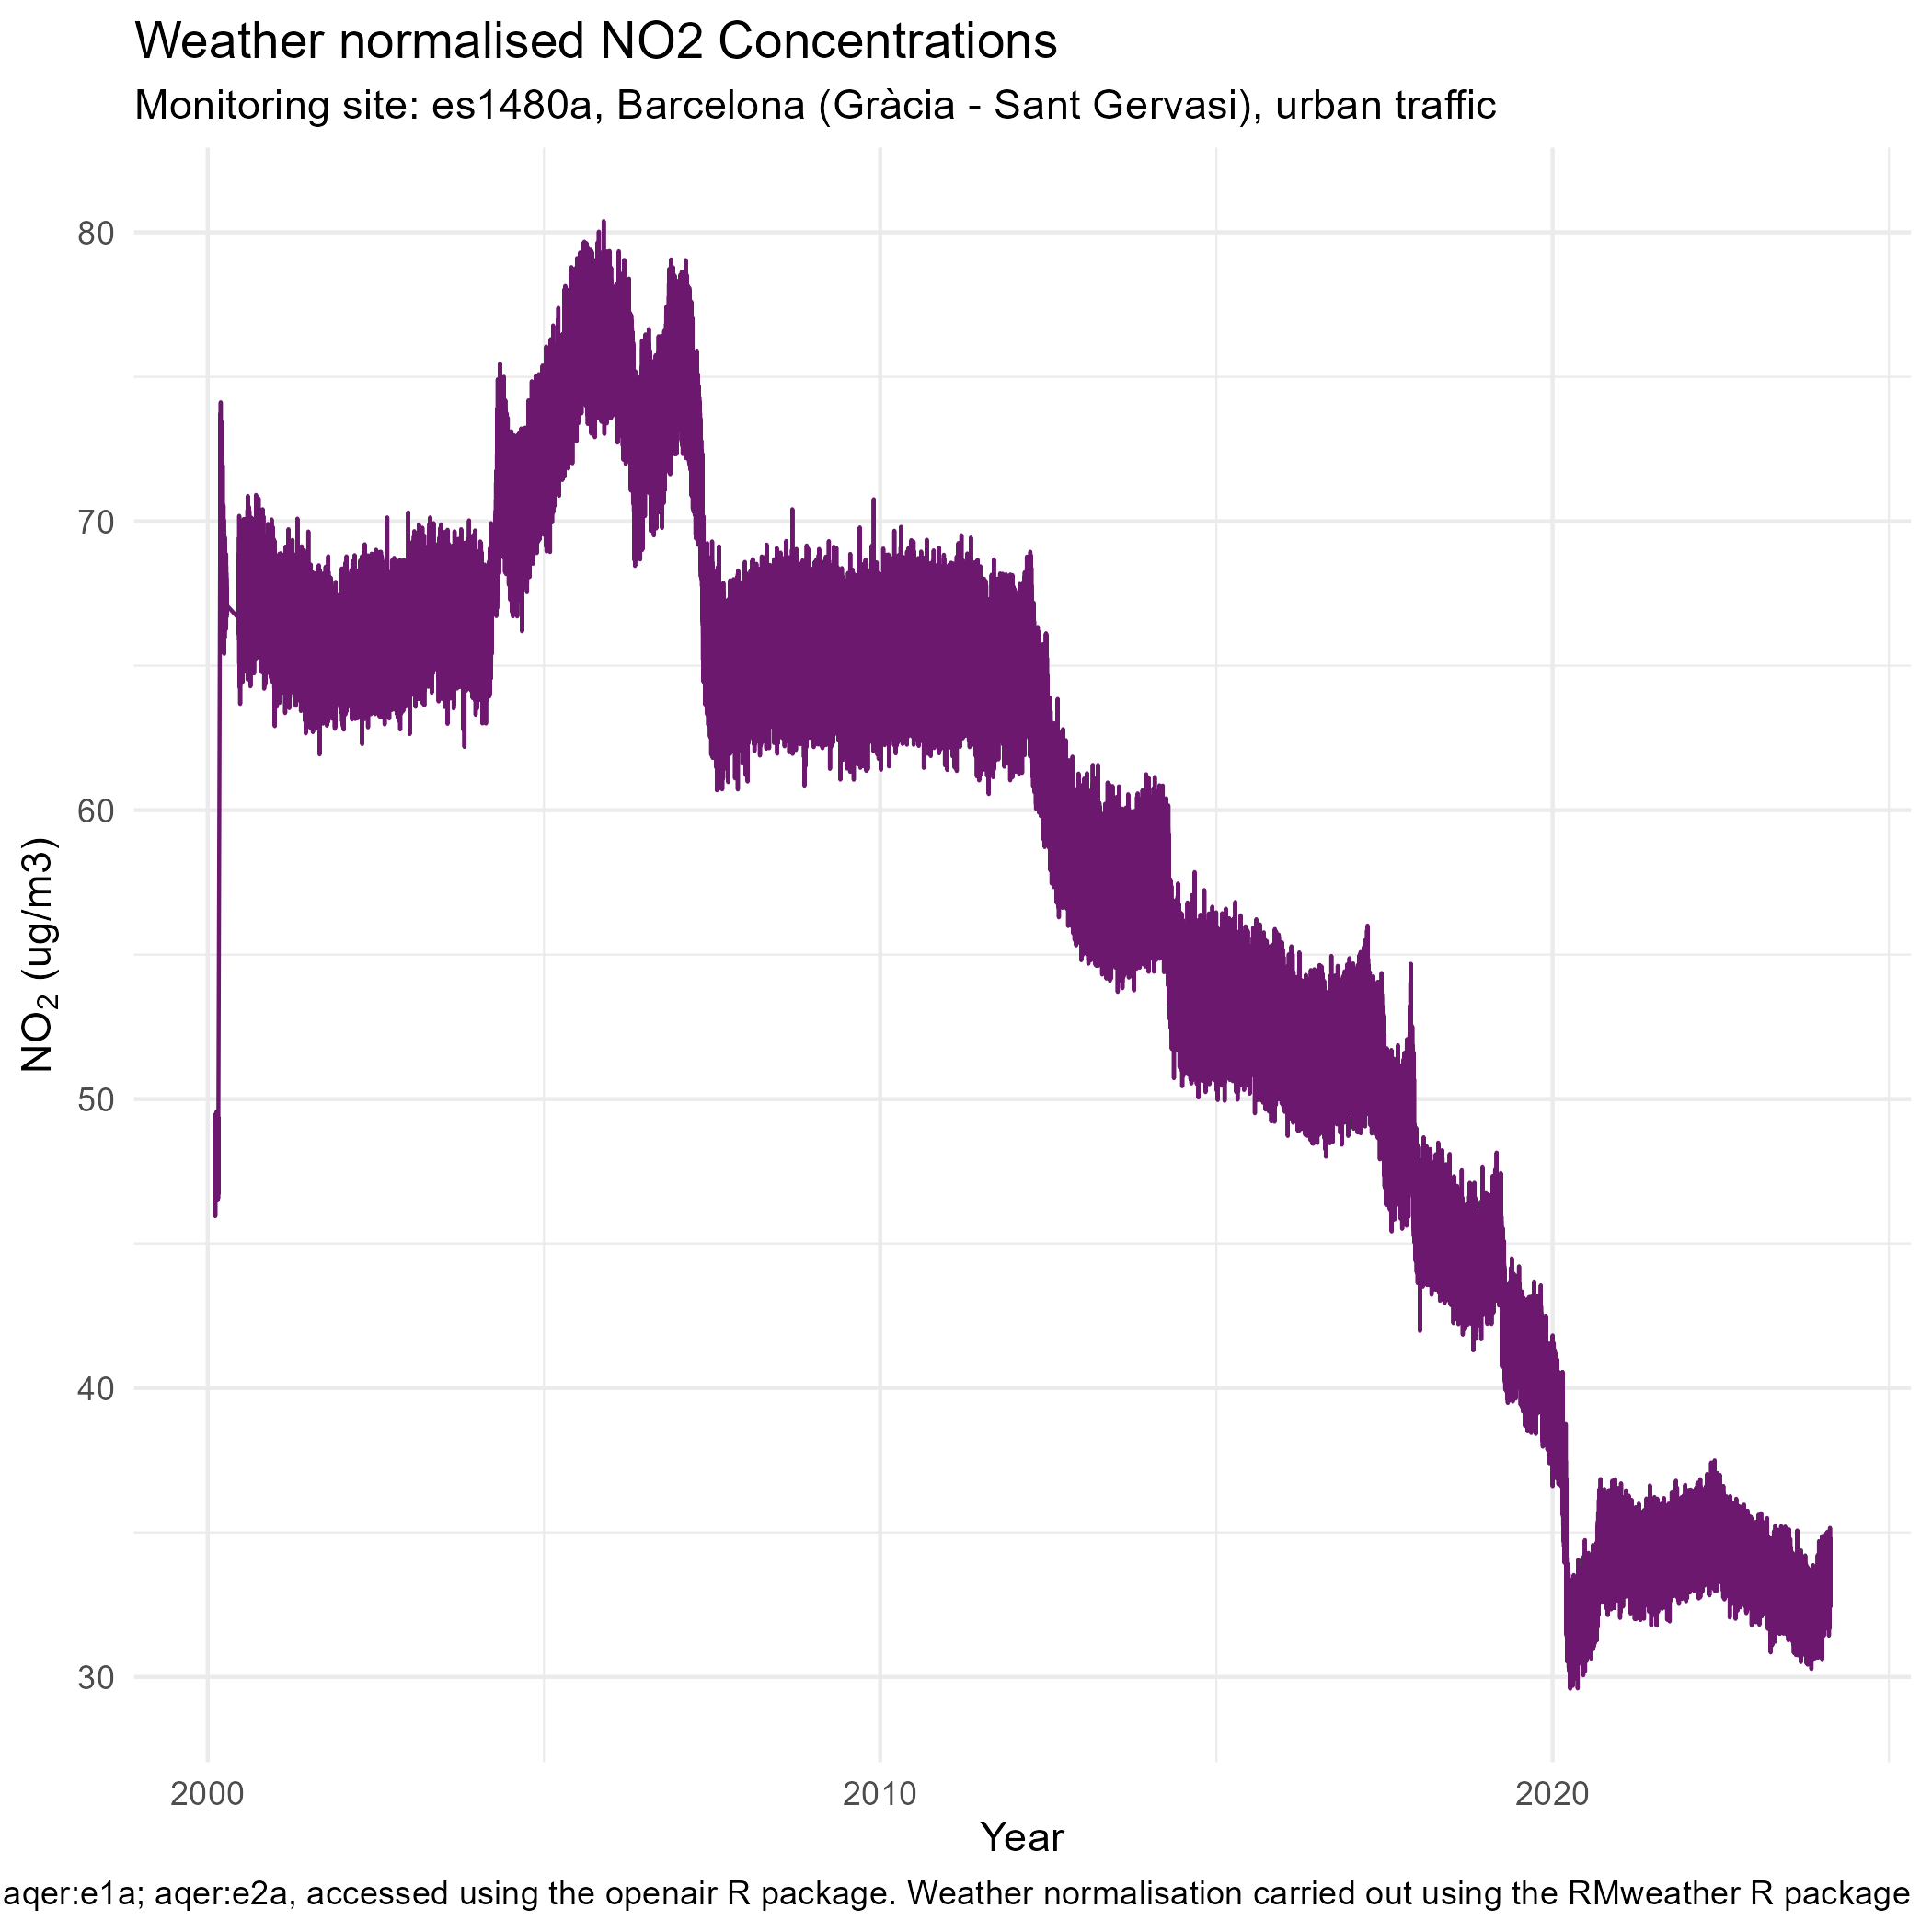
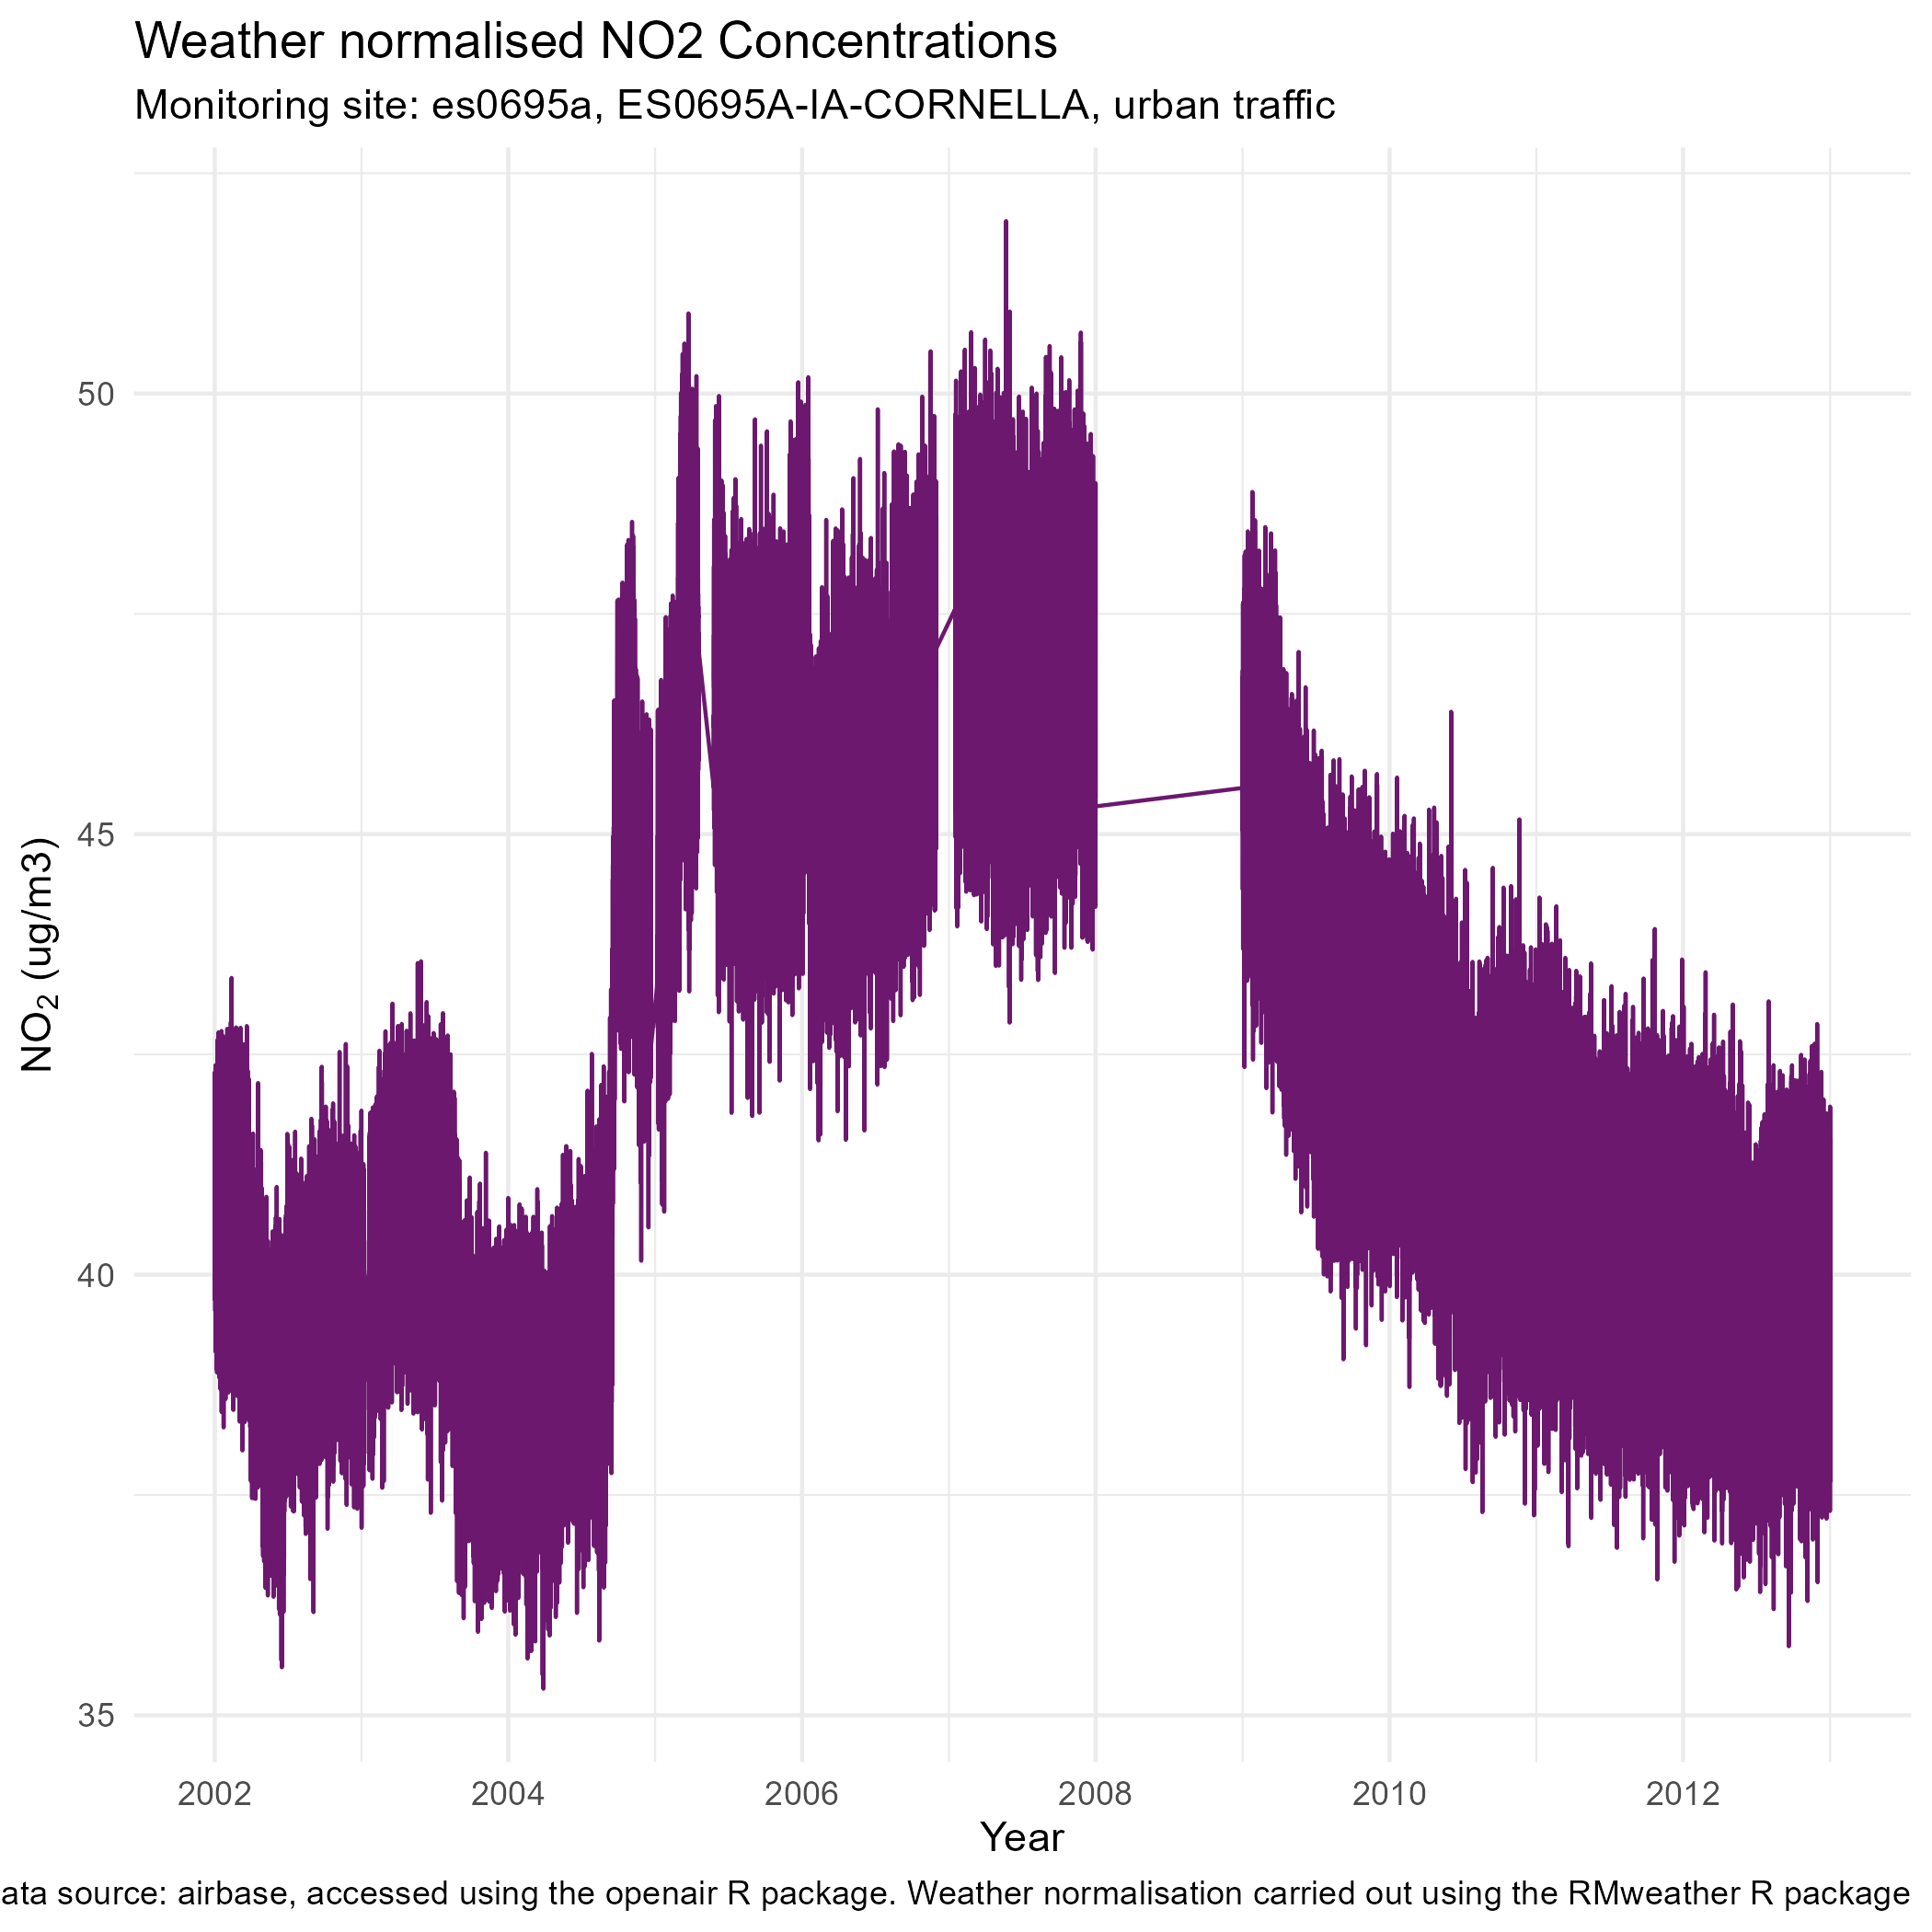
The second is to meteorologically normalise the data and remove the effect of the weather, which is in many cases a stronger influence on local concentrations than sources themselves. This allows patterns from sources to be more visible.
Sant Adria de Beso (Olimpic) es1148a
NO2
concentrations by wind direction and speed for last 5 years
Normalised concentrations since monitor installed
PM10
concentrations by wind direction and speed for last 5 years
Normalised concentrations since monitor installed
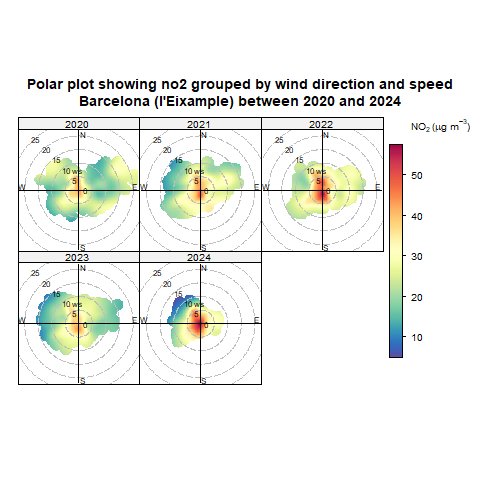
 ## Barcelon (I’Eixample) es1438a
NO2
concentrations by wind direction and speed for last 5 years
Normalised concentrations since monitor installed
PM10
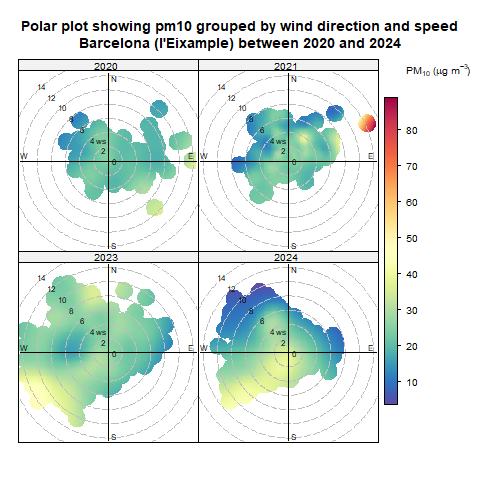
Normalised concentrations since monitor installed
Barcelona (Gracia - Sant Gervasi) es1480a
NO2
Normalised concentrations since monitor installed
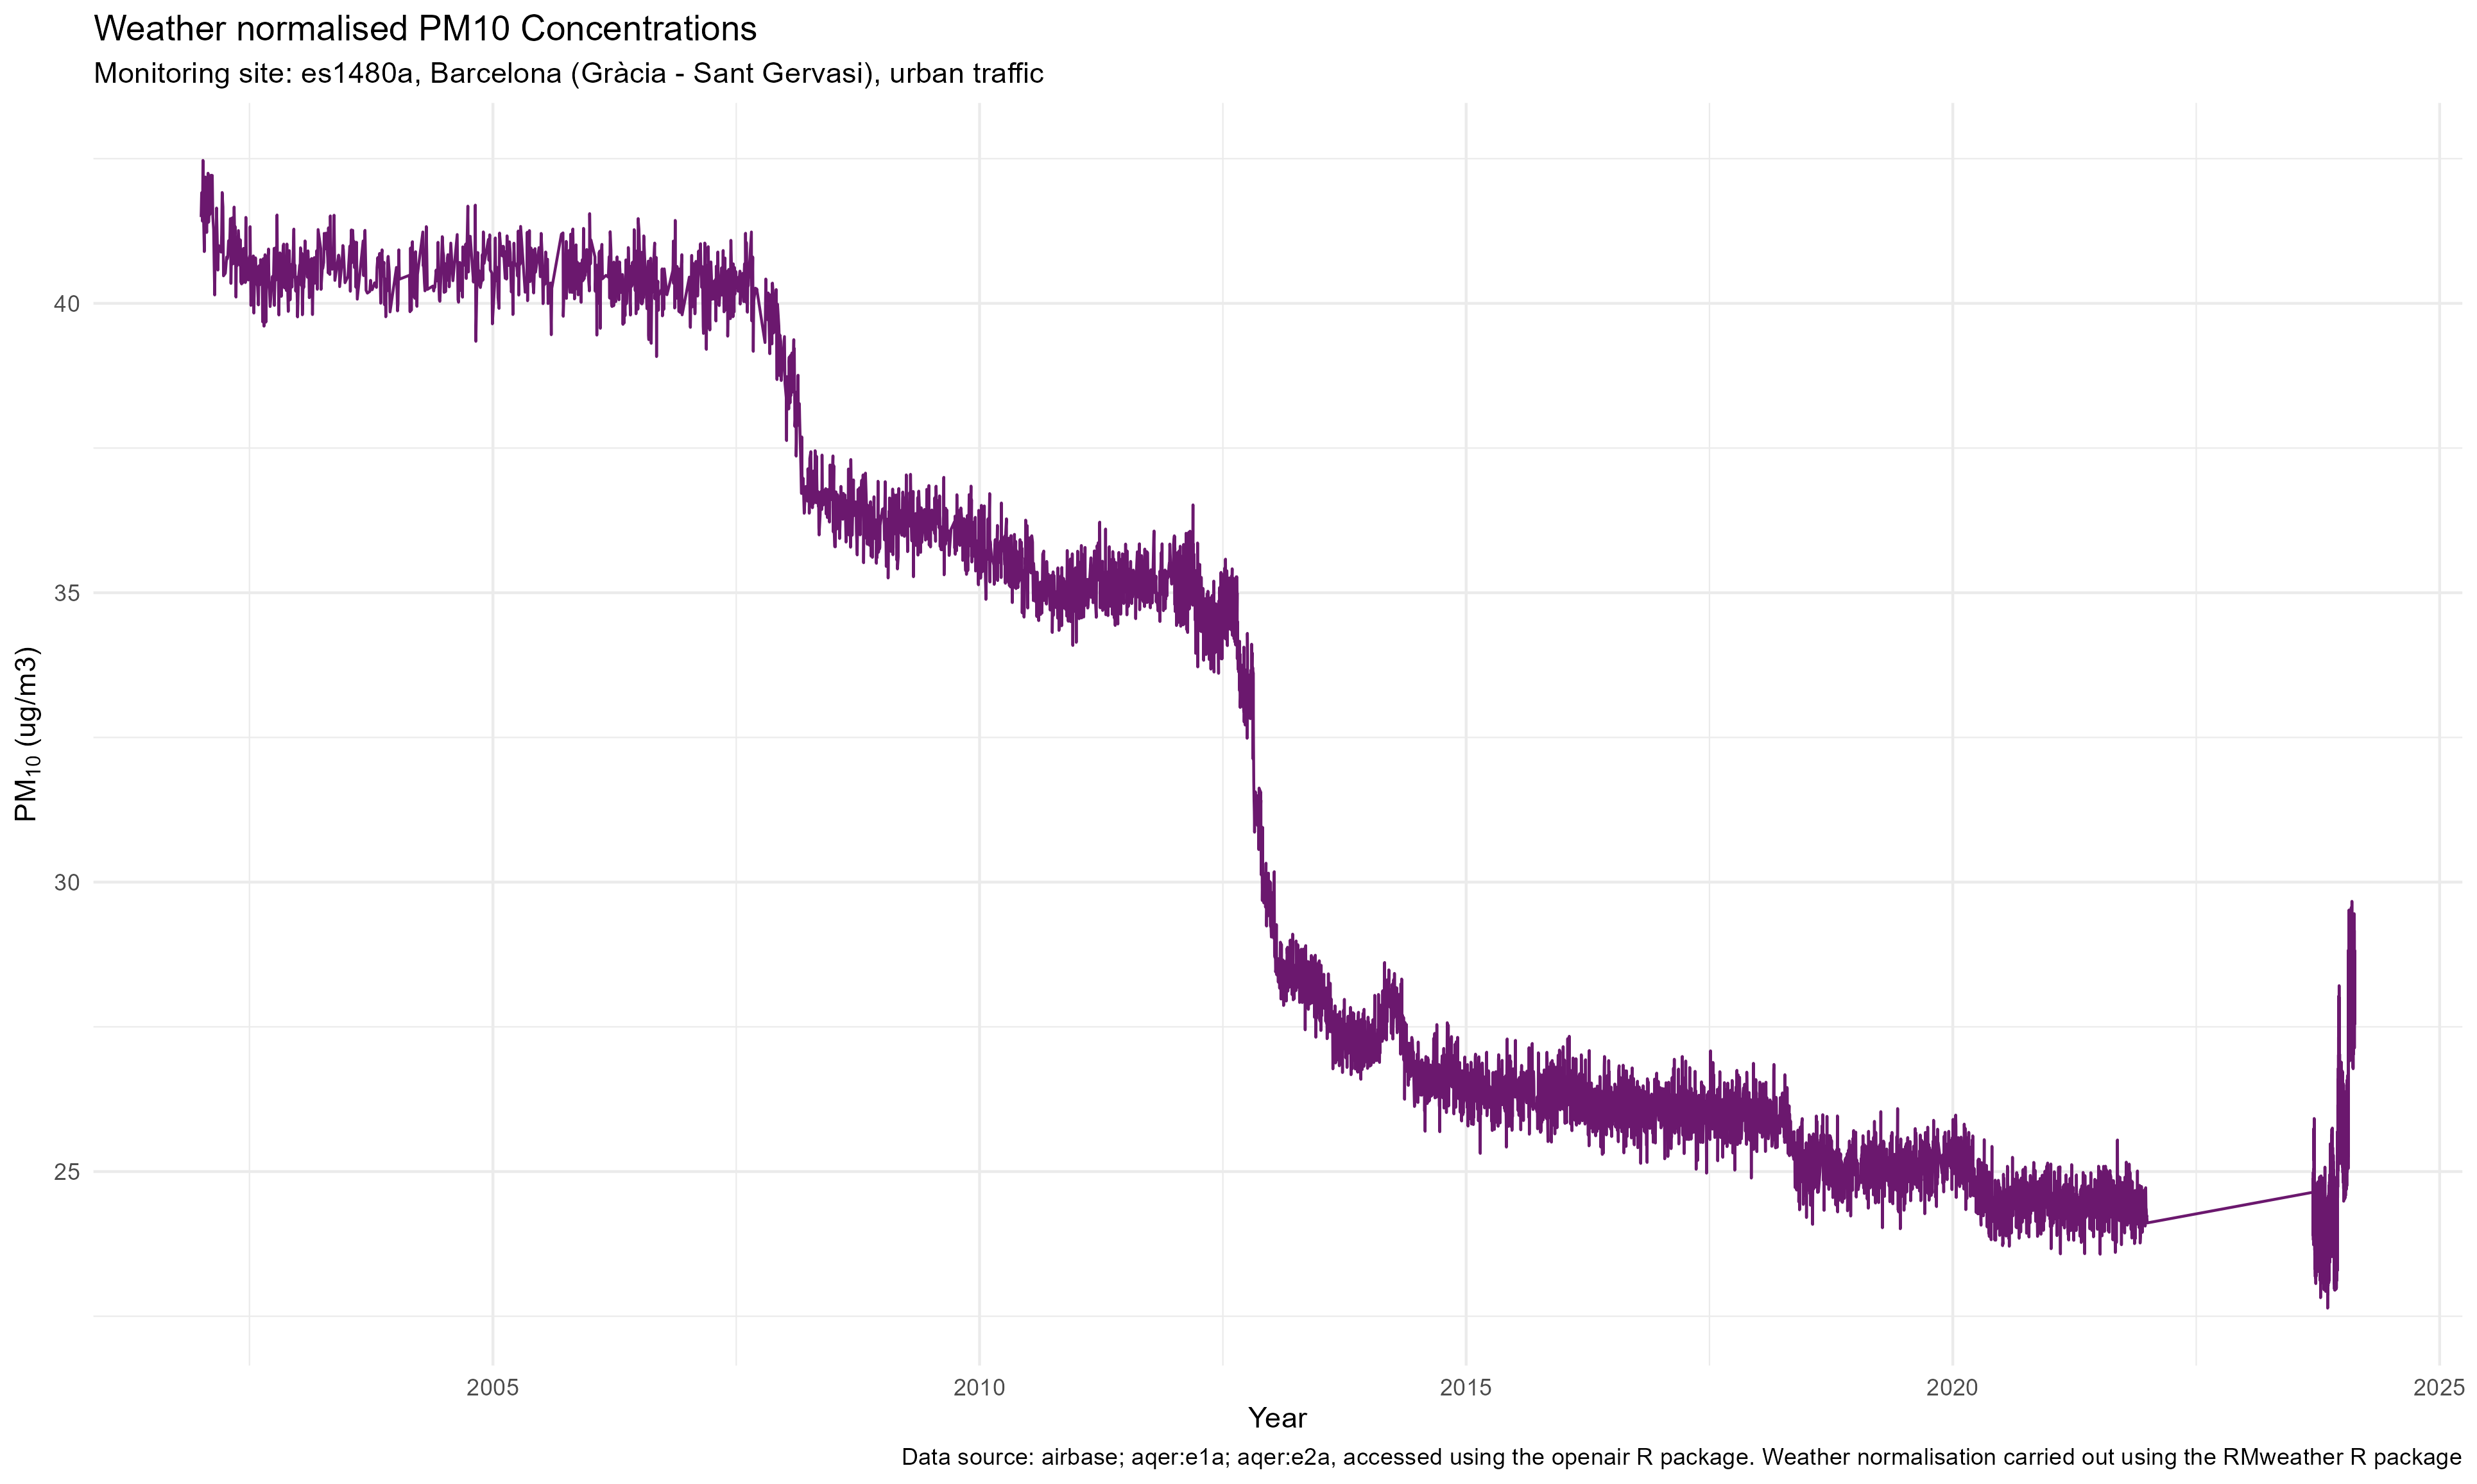
PM10
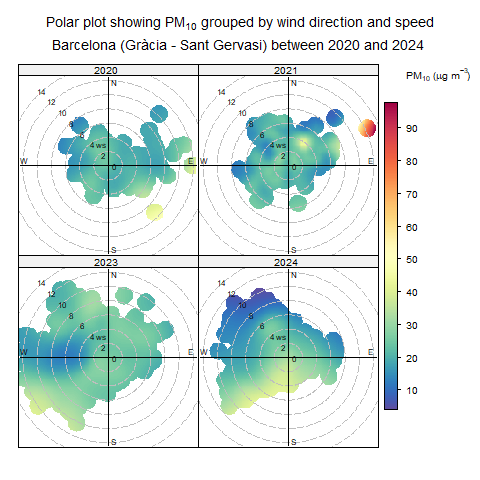
Normalised concentrations since monitor installed
 ## Barcelona (pl. de la Universitat) es0559a
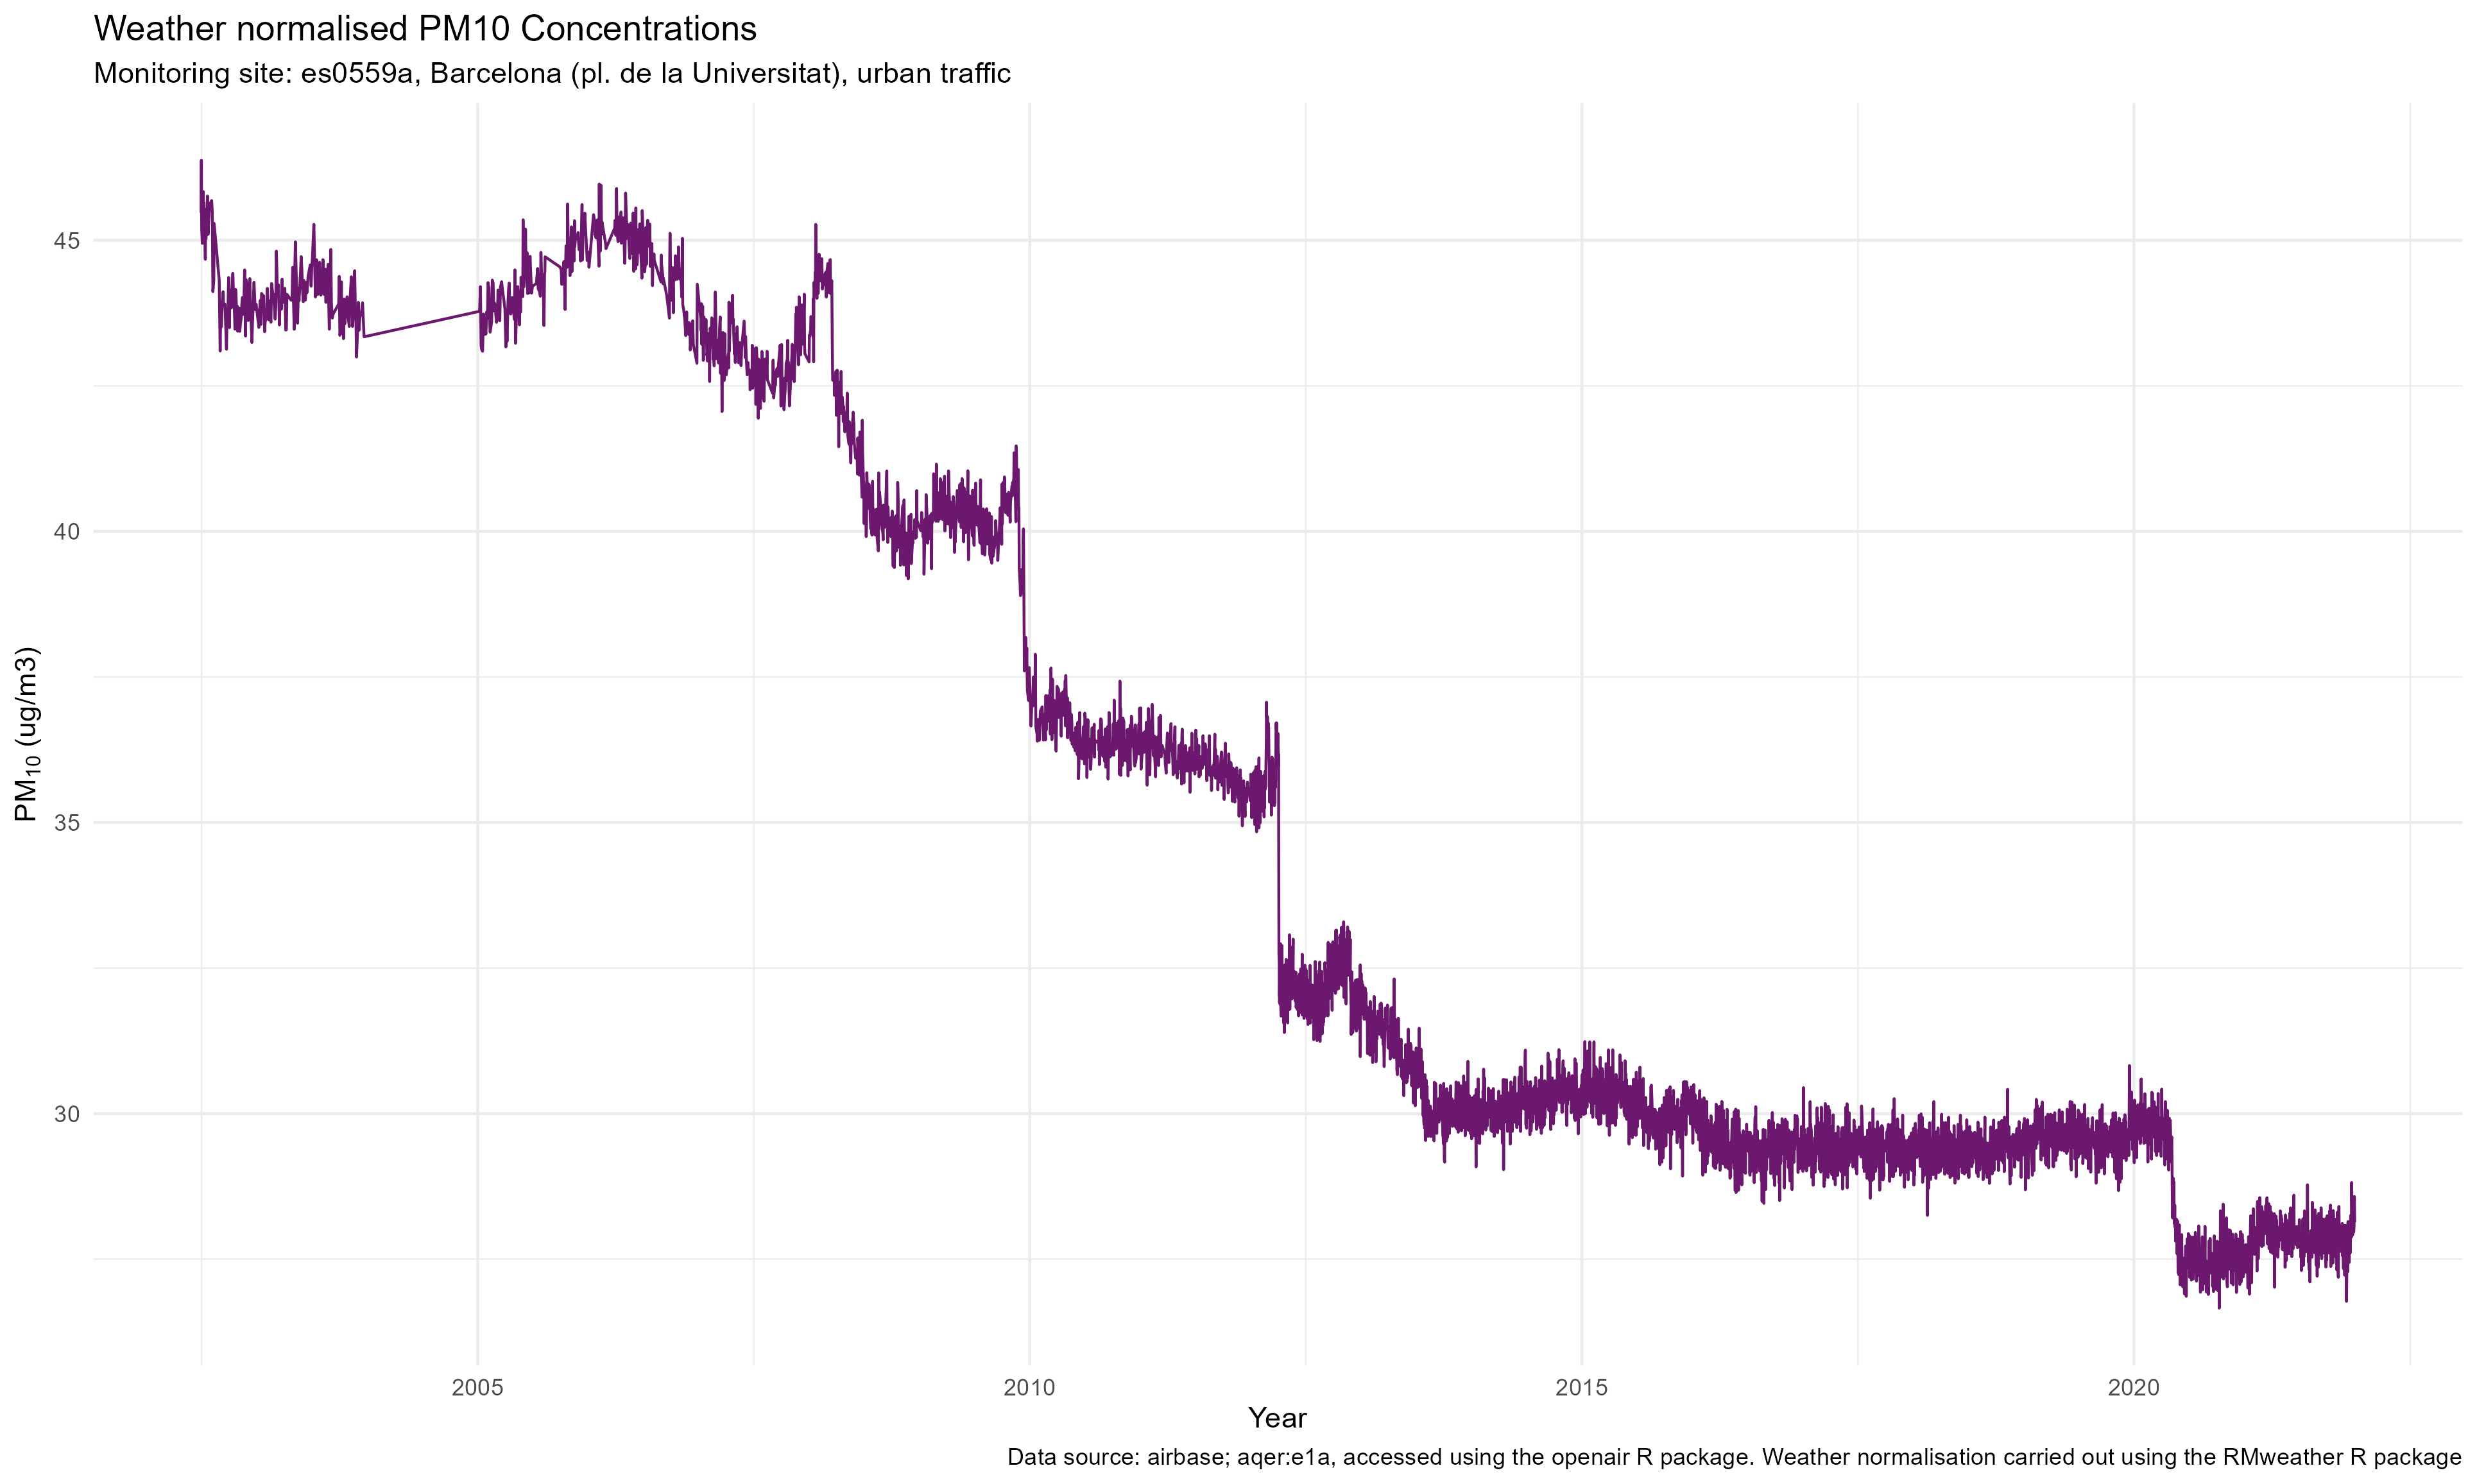
PM10
Normalised concentrations since monitor installed
I5 Badalona es0693a
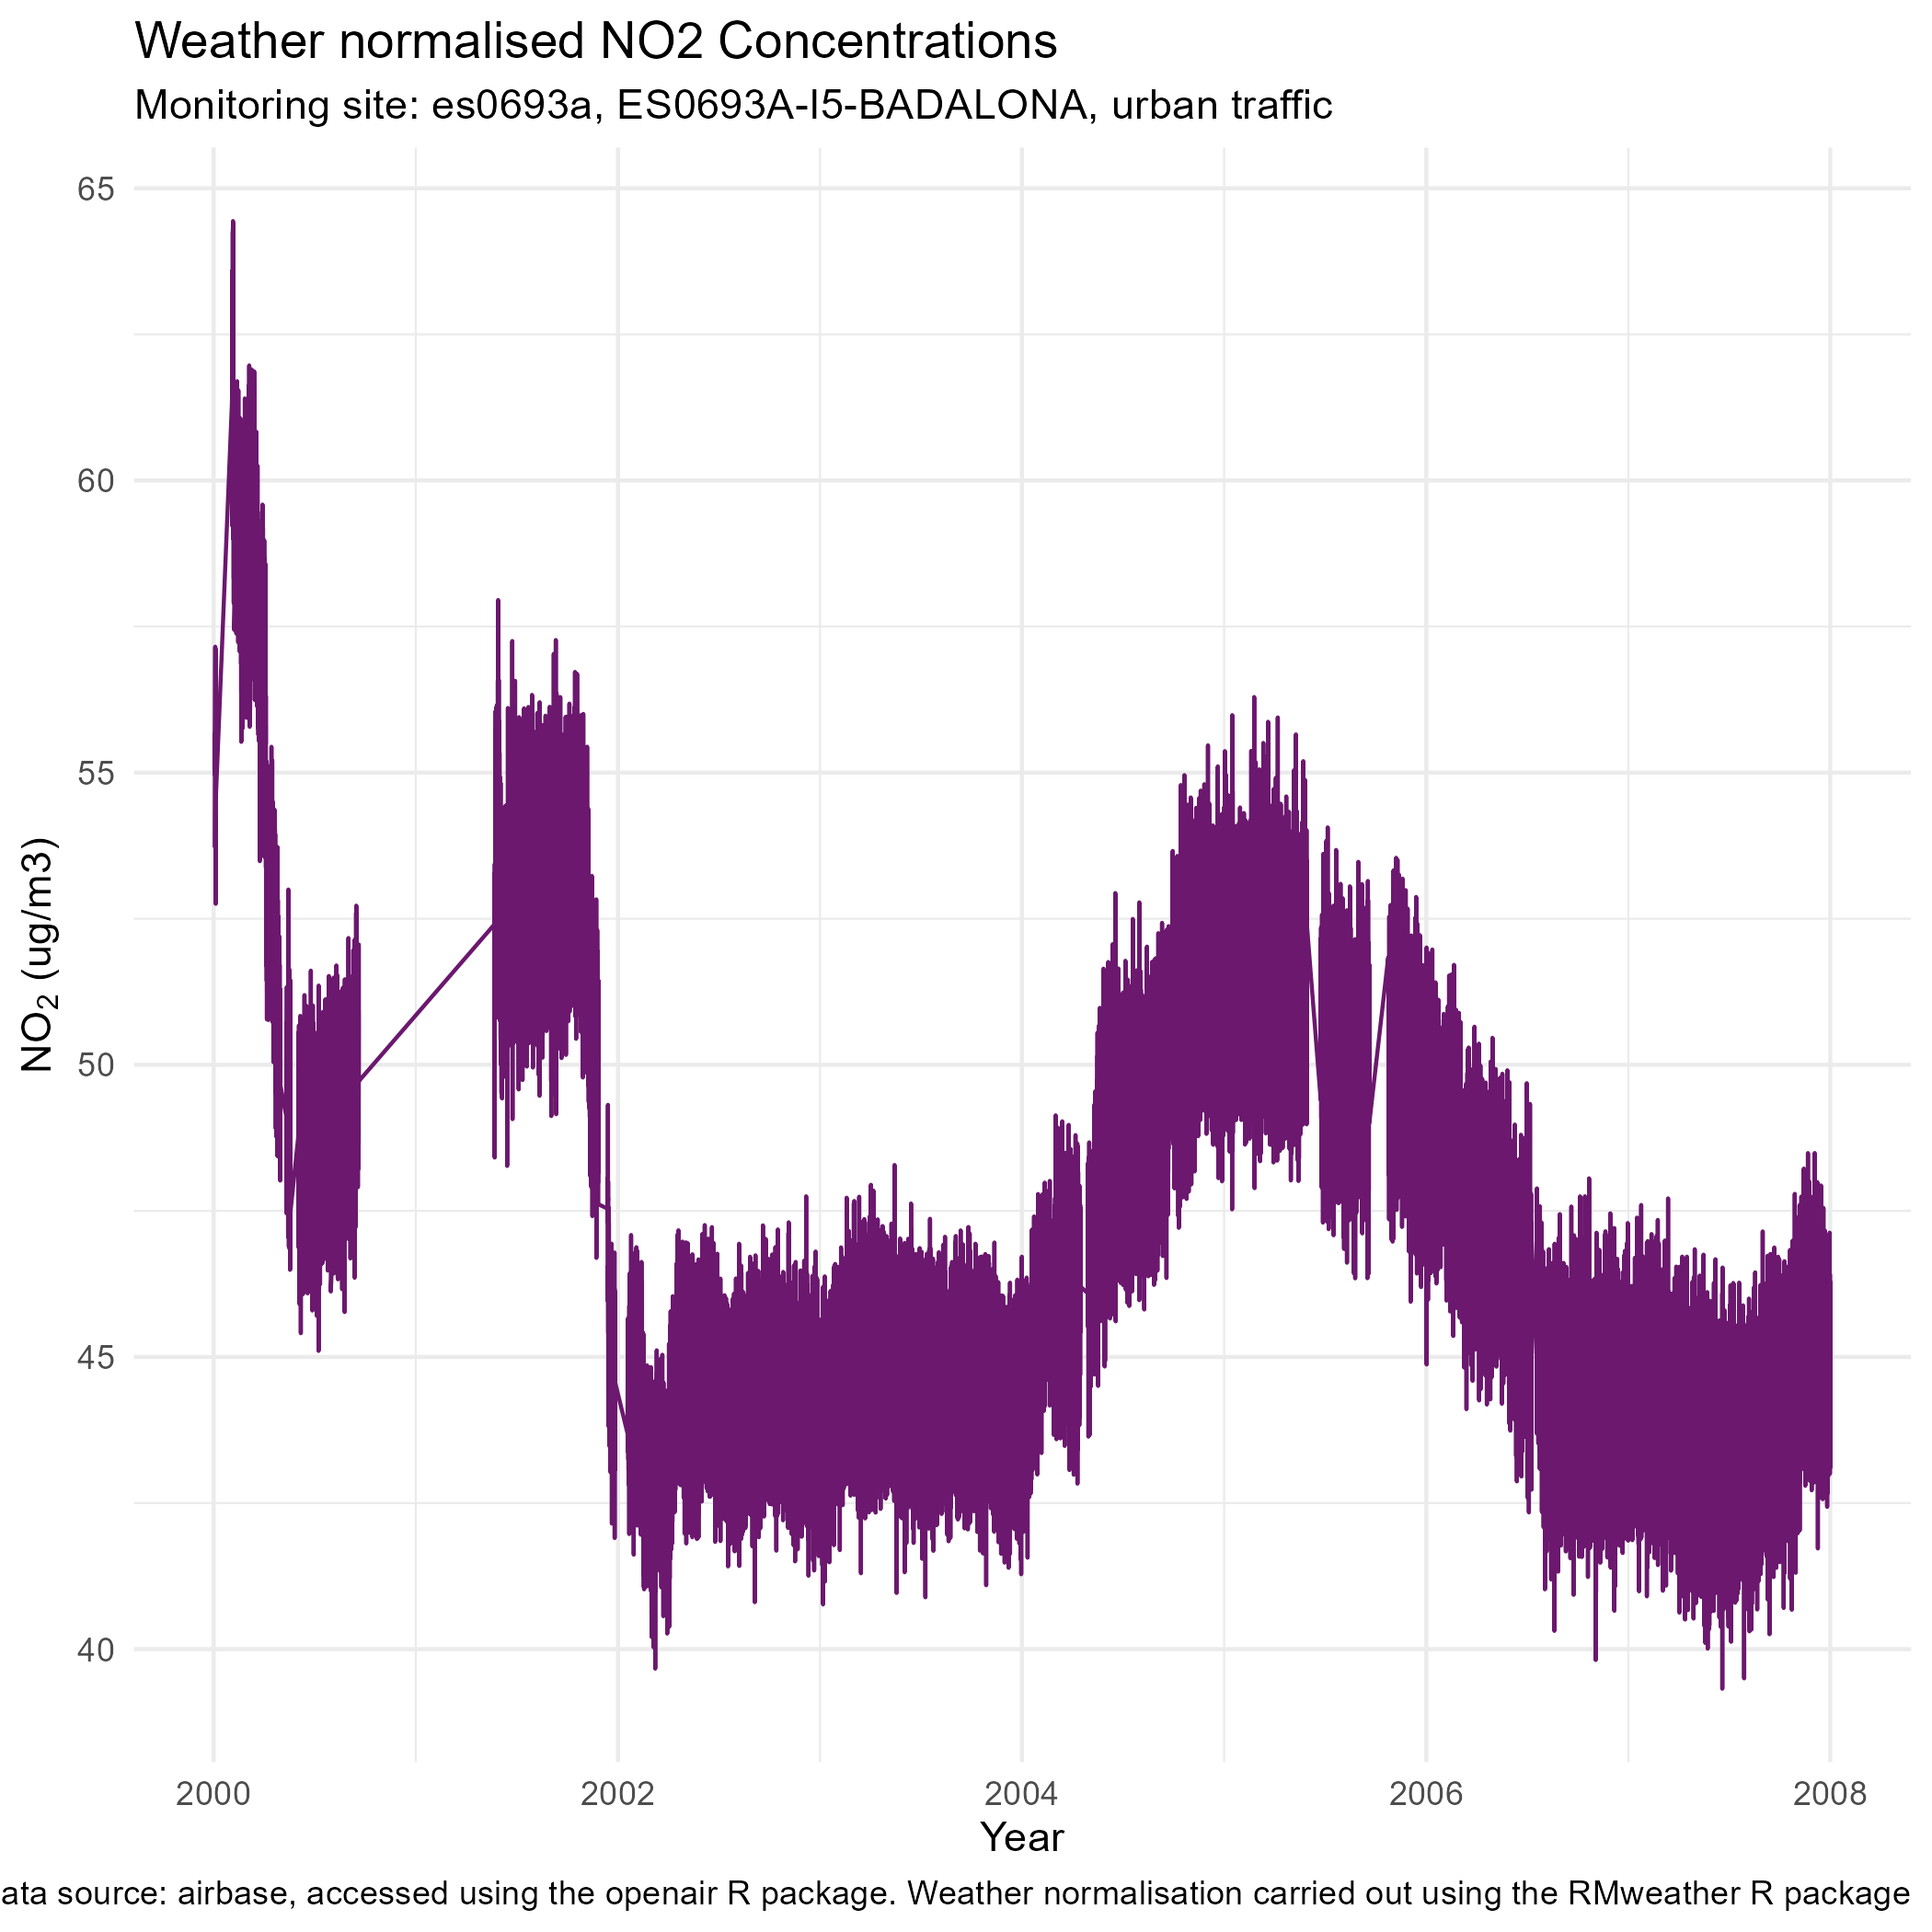
NO2
Normalised concentrations since monitor installed
IA Cornella es0695a
NO2
Normalised concentrations since monitor installed
Cycle Network
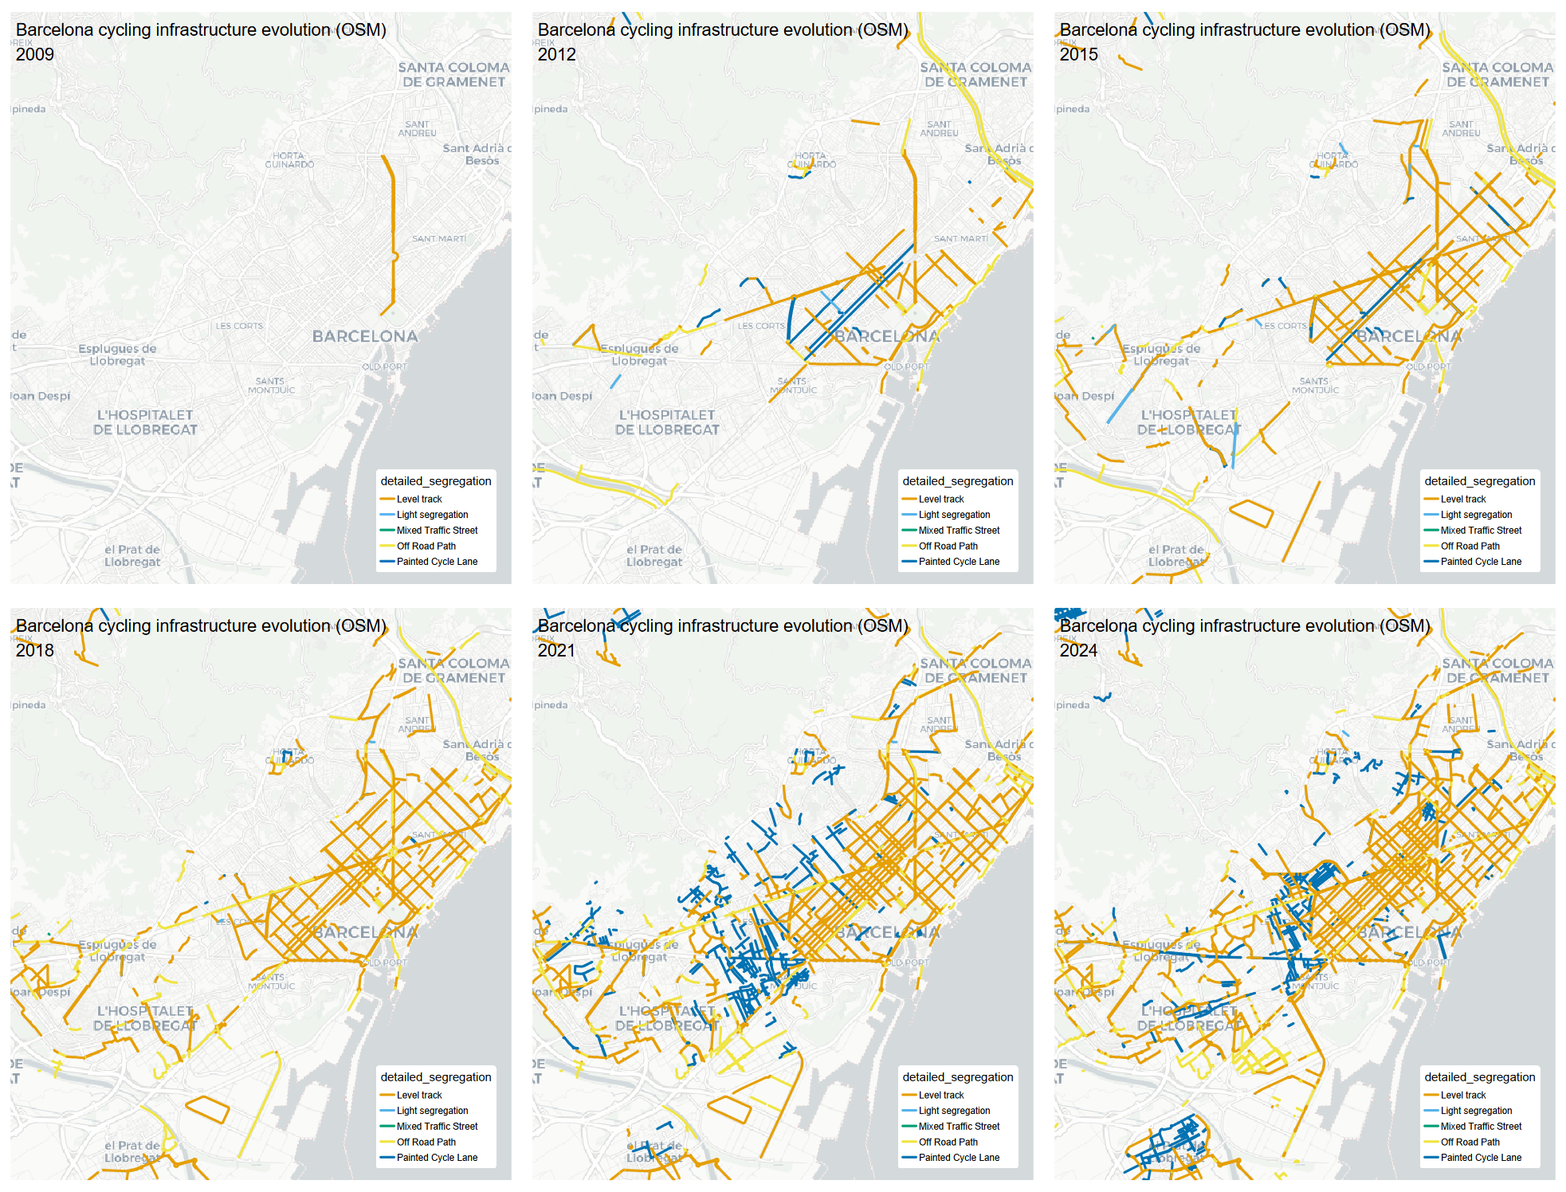
The evolution of the Barcelona cycle network,since 2009 according to OSM data, is shown below. Historic data was obtained using the ohsome R package and processed with osmactive. Also shown on an interactive map