North West Wildfires
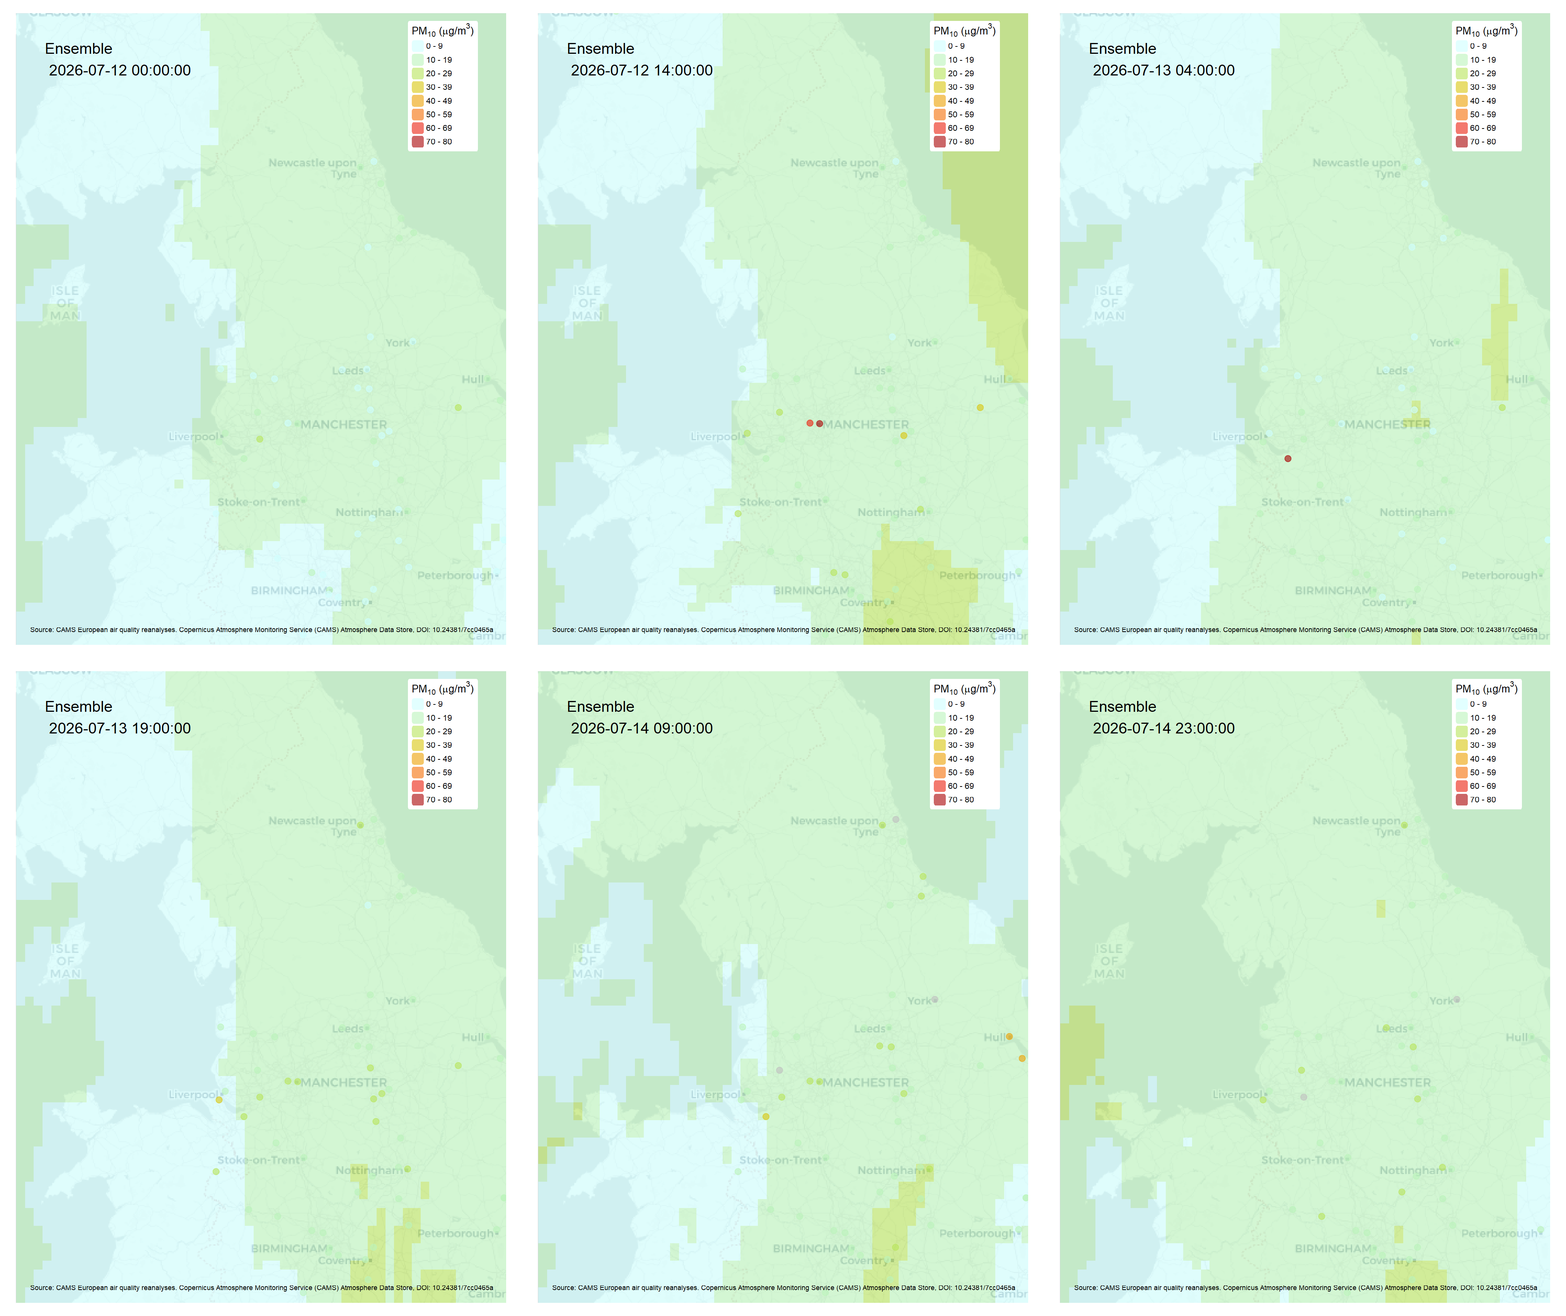
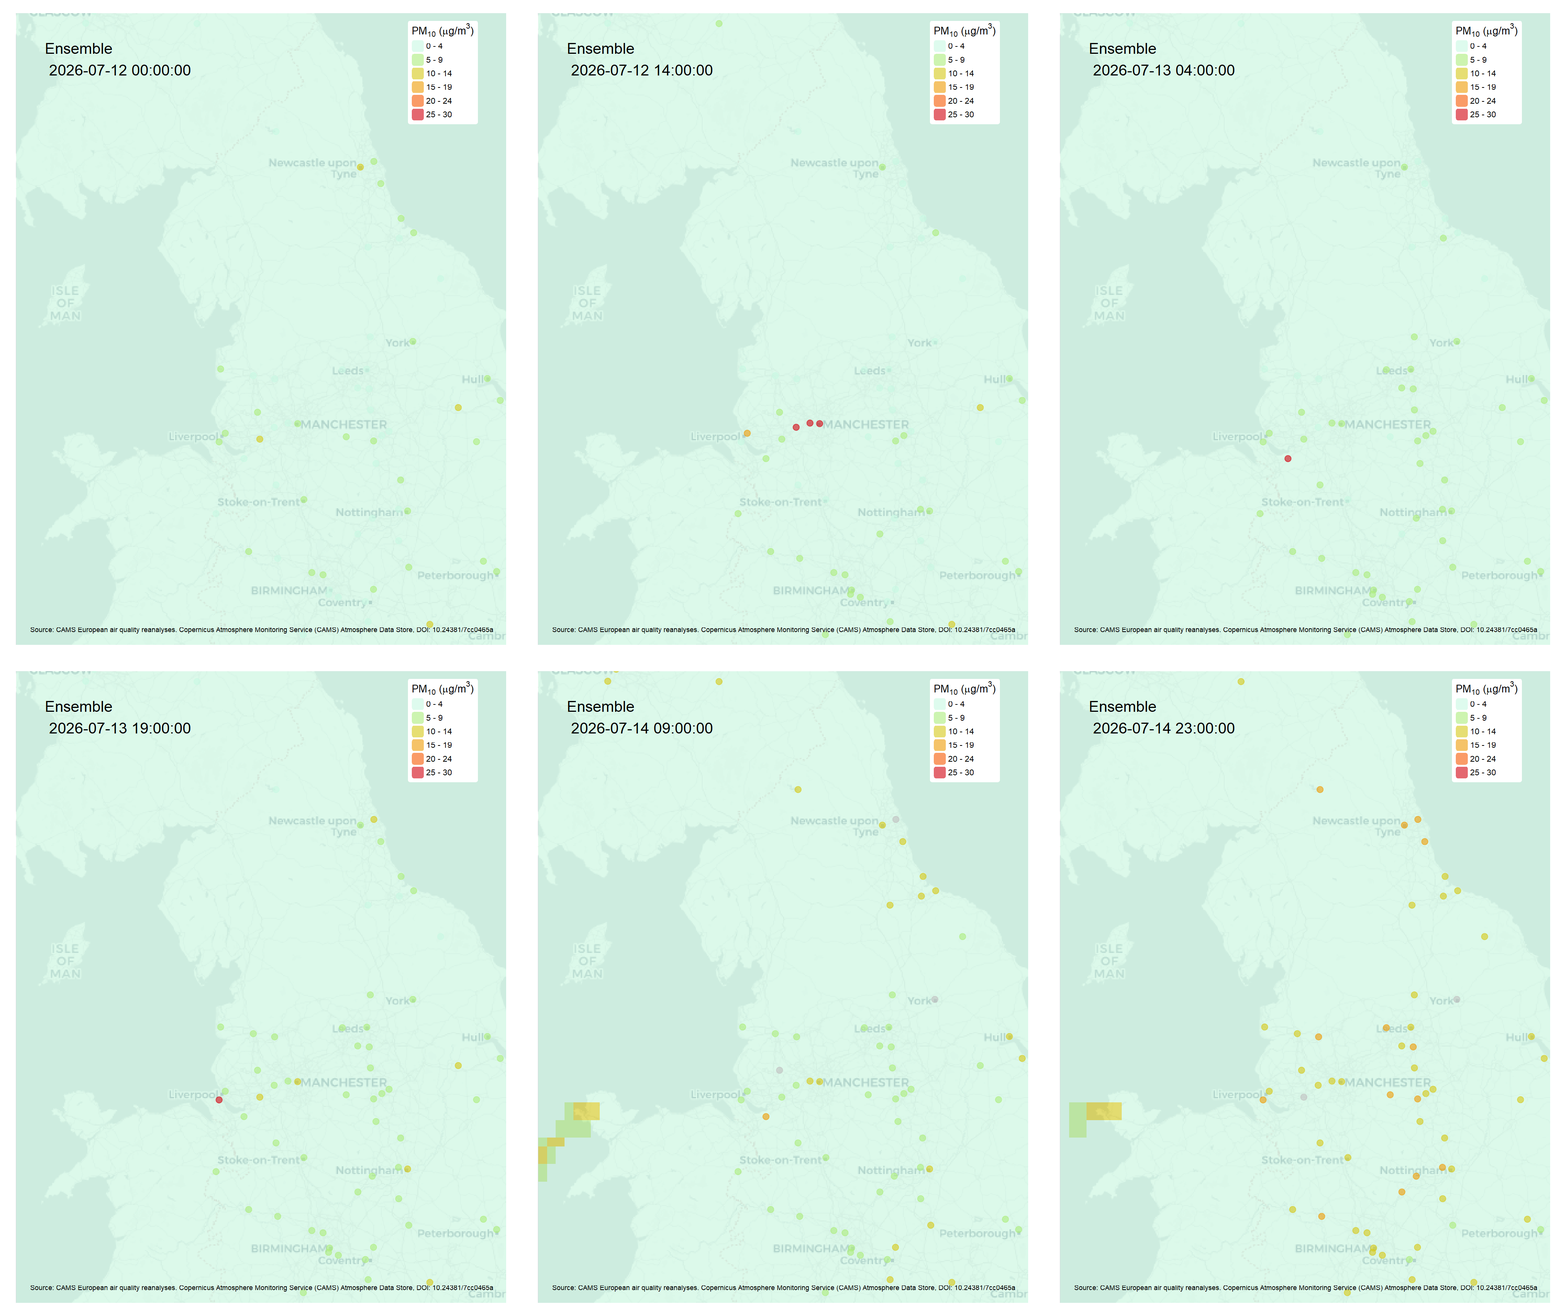
The Copernicus Atmosphere Monitoring Service (CAMS), publically available from the Atmospheric Data Store (ADS) pulls together 11 state of the art Chemistry Transport Models (CTM). An Ensemble Median of these models is also calculated. This data was downloaded using the ecmwfr R package for the period 12-07-2026 and 14-07-2026 has been plotted below for northern England. Also shown are the observation sites for this area from the local, aurn, saqn, waqn and aqe networks using the openair R package), coloured by the hourly mean concentrations.
 One of the variables available from the ADS is PM10 wildfire concentrations. Many of the models use the Global Fire Assimilation System (GFAS) which is based on satellite observations of heat to estimate where fires might be. This is plotted below, also for the Ensemble Median.
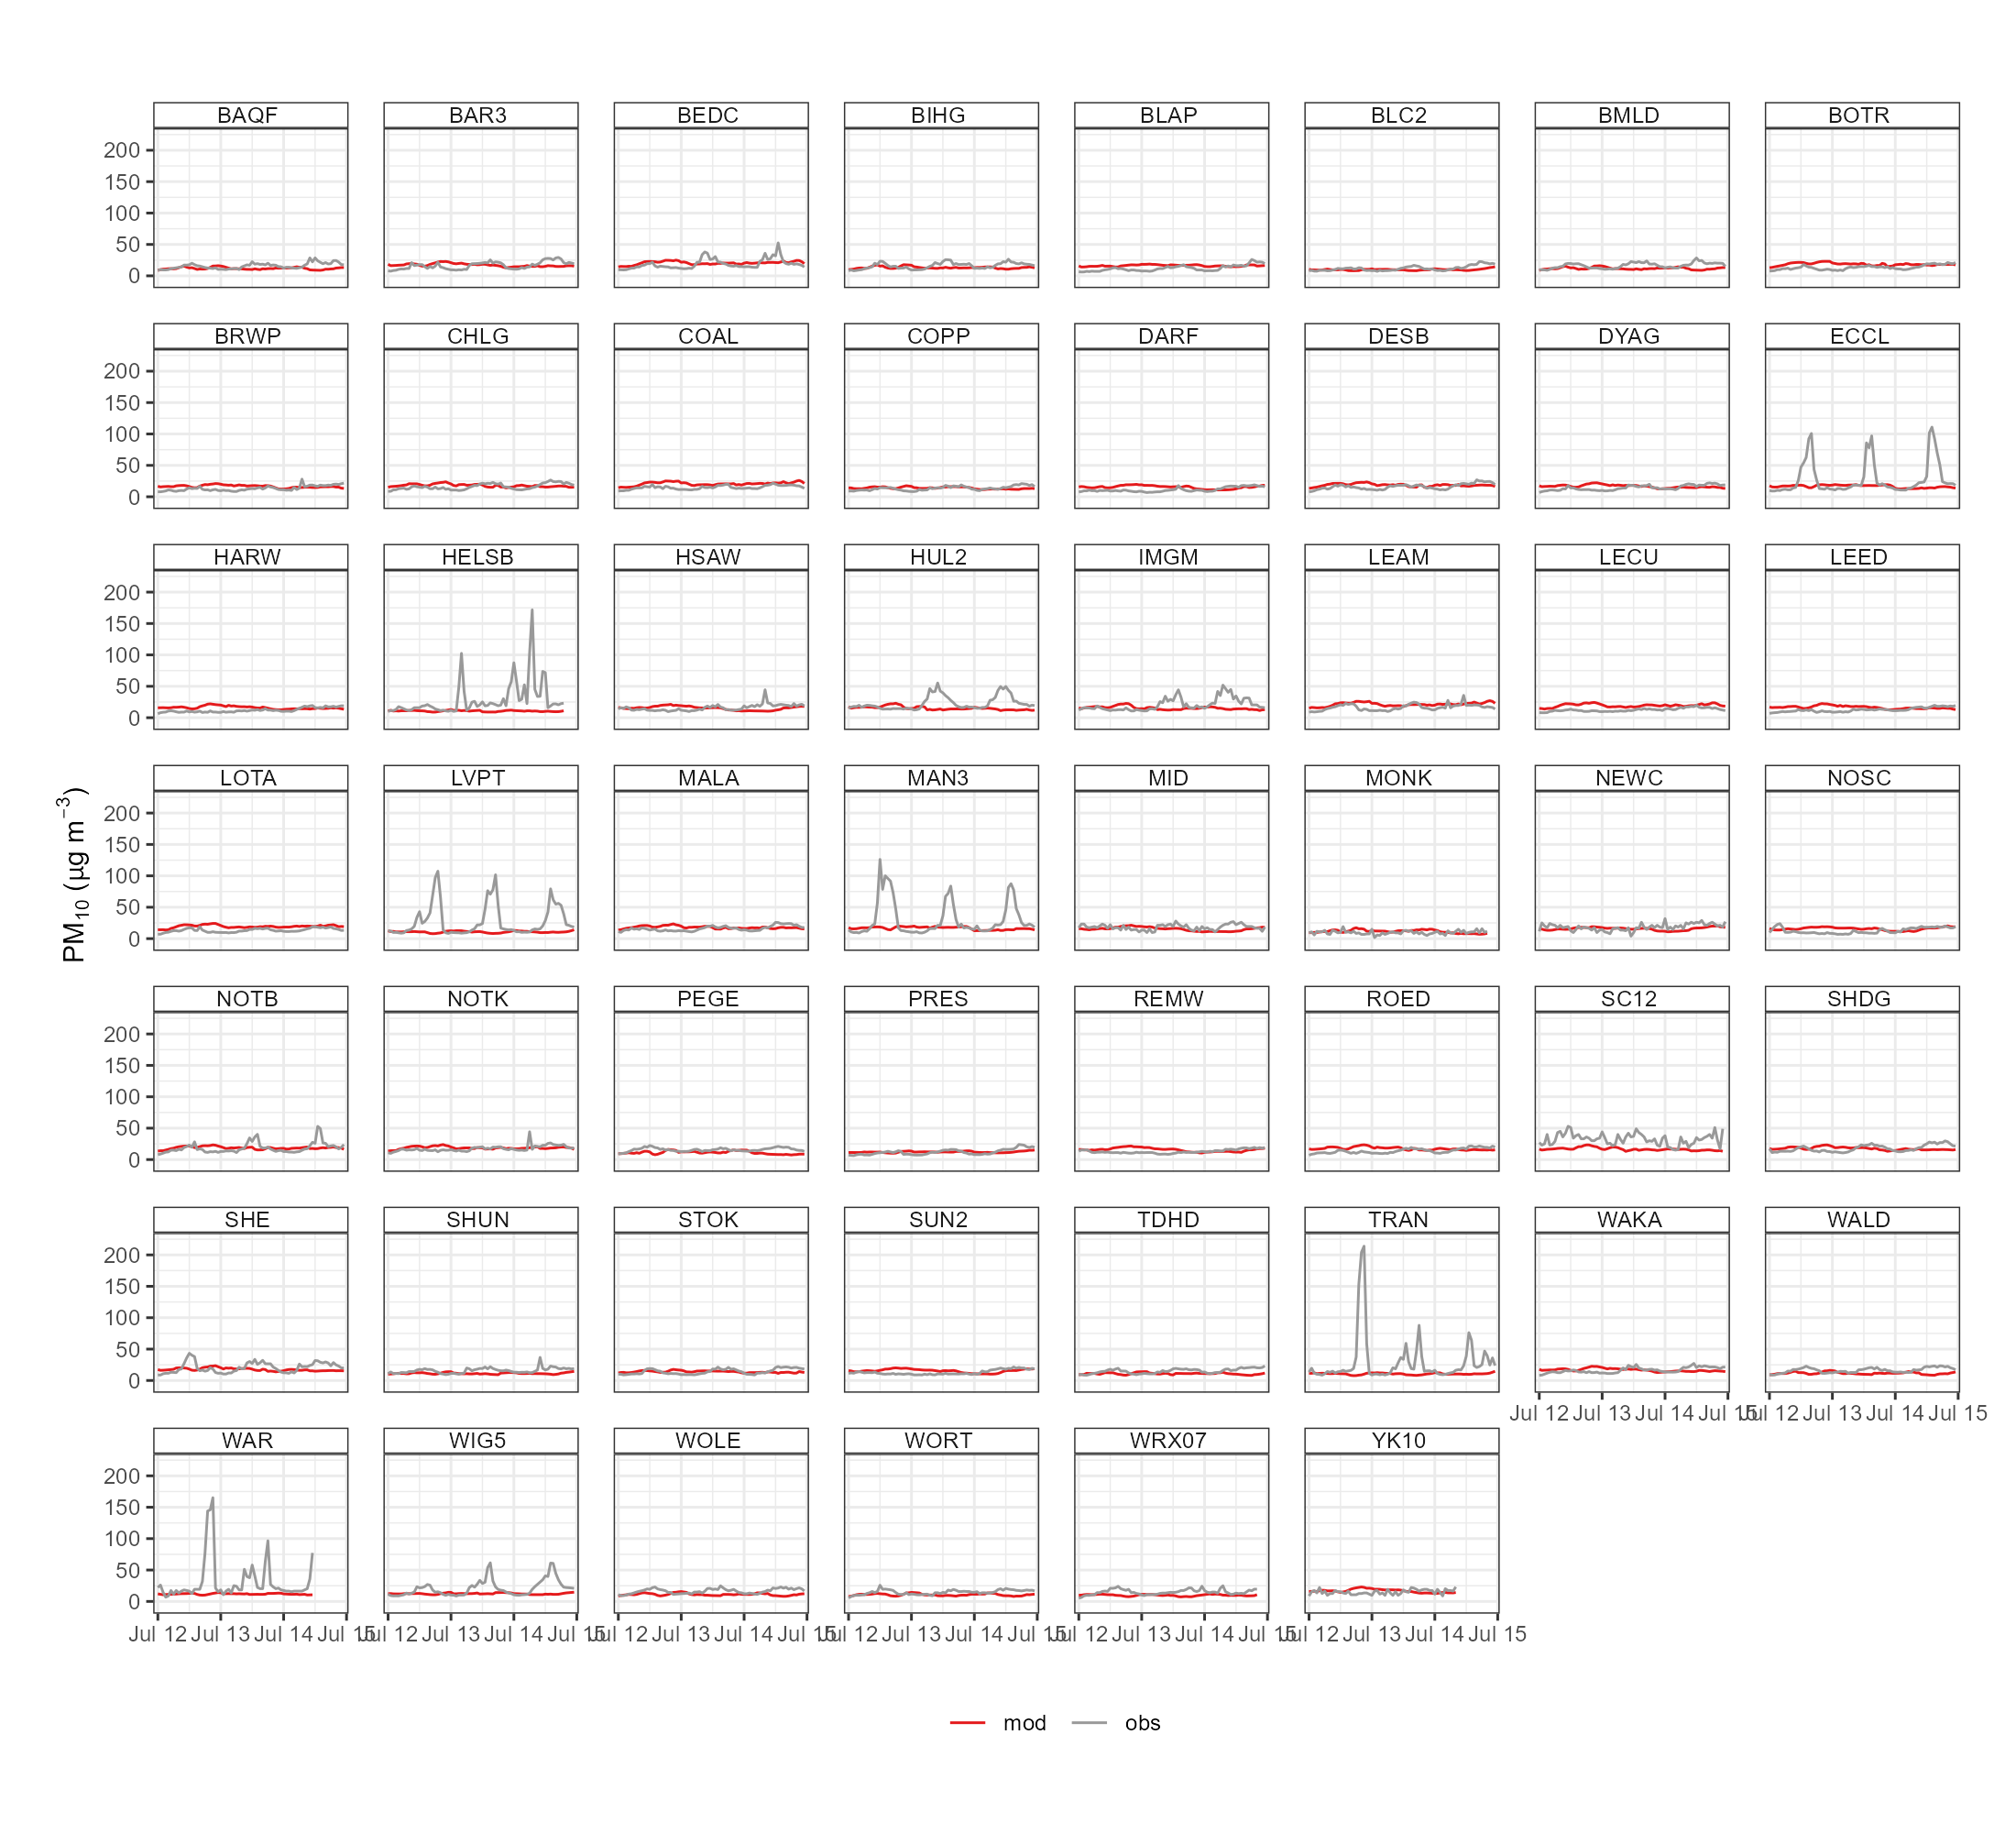
  Plotting all the background observation sites (black line) against the Ensemble Median (red line).
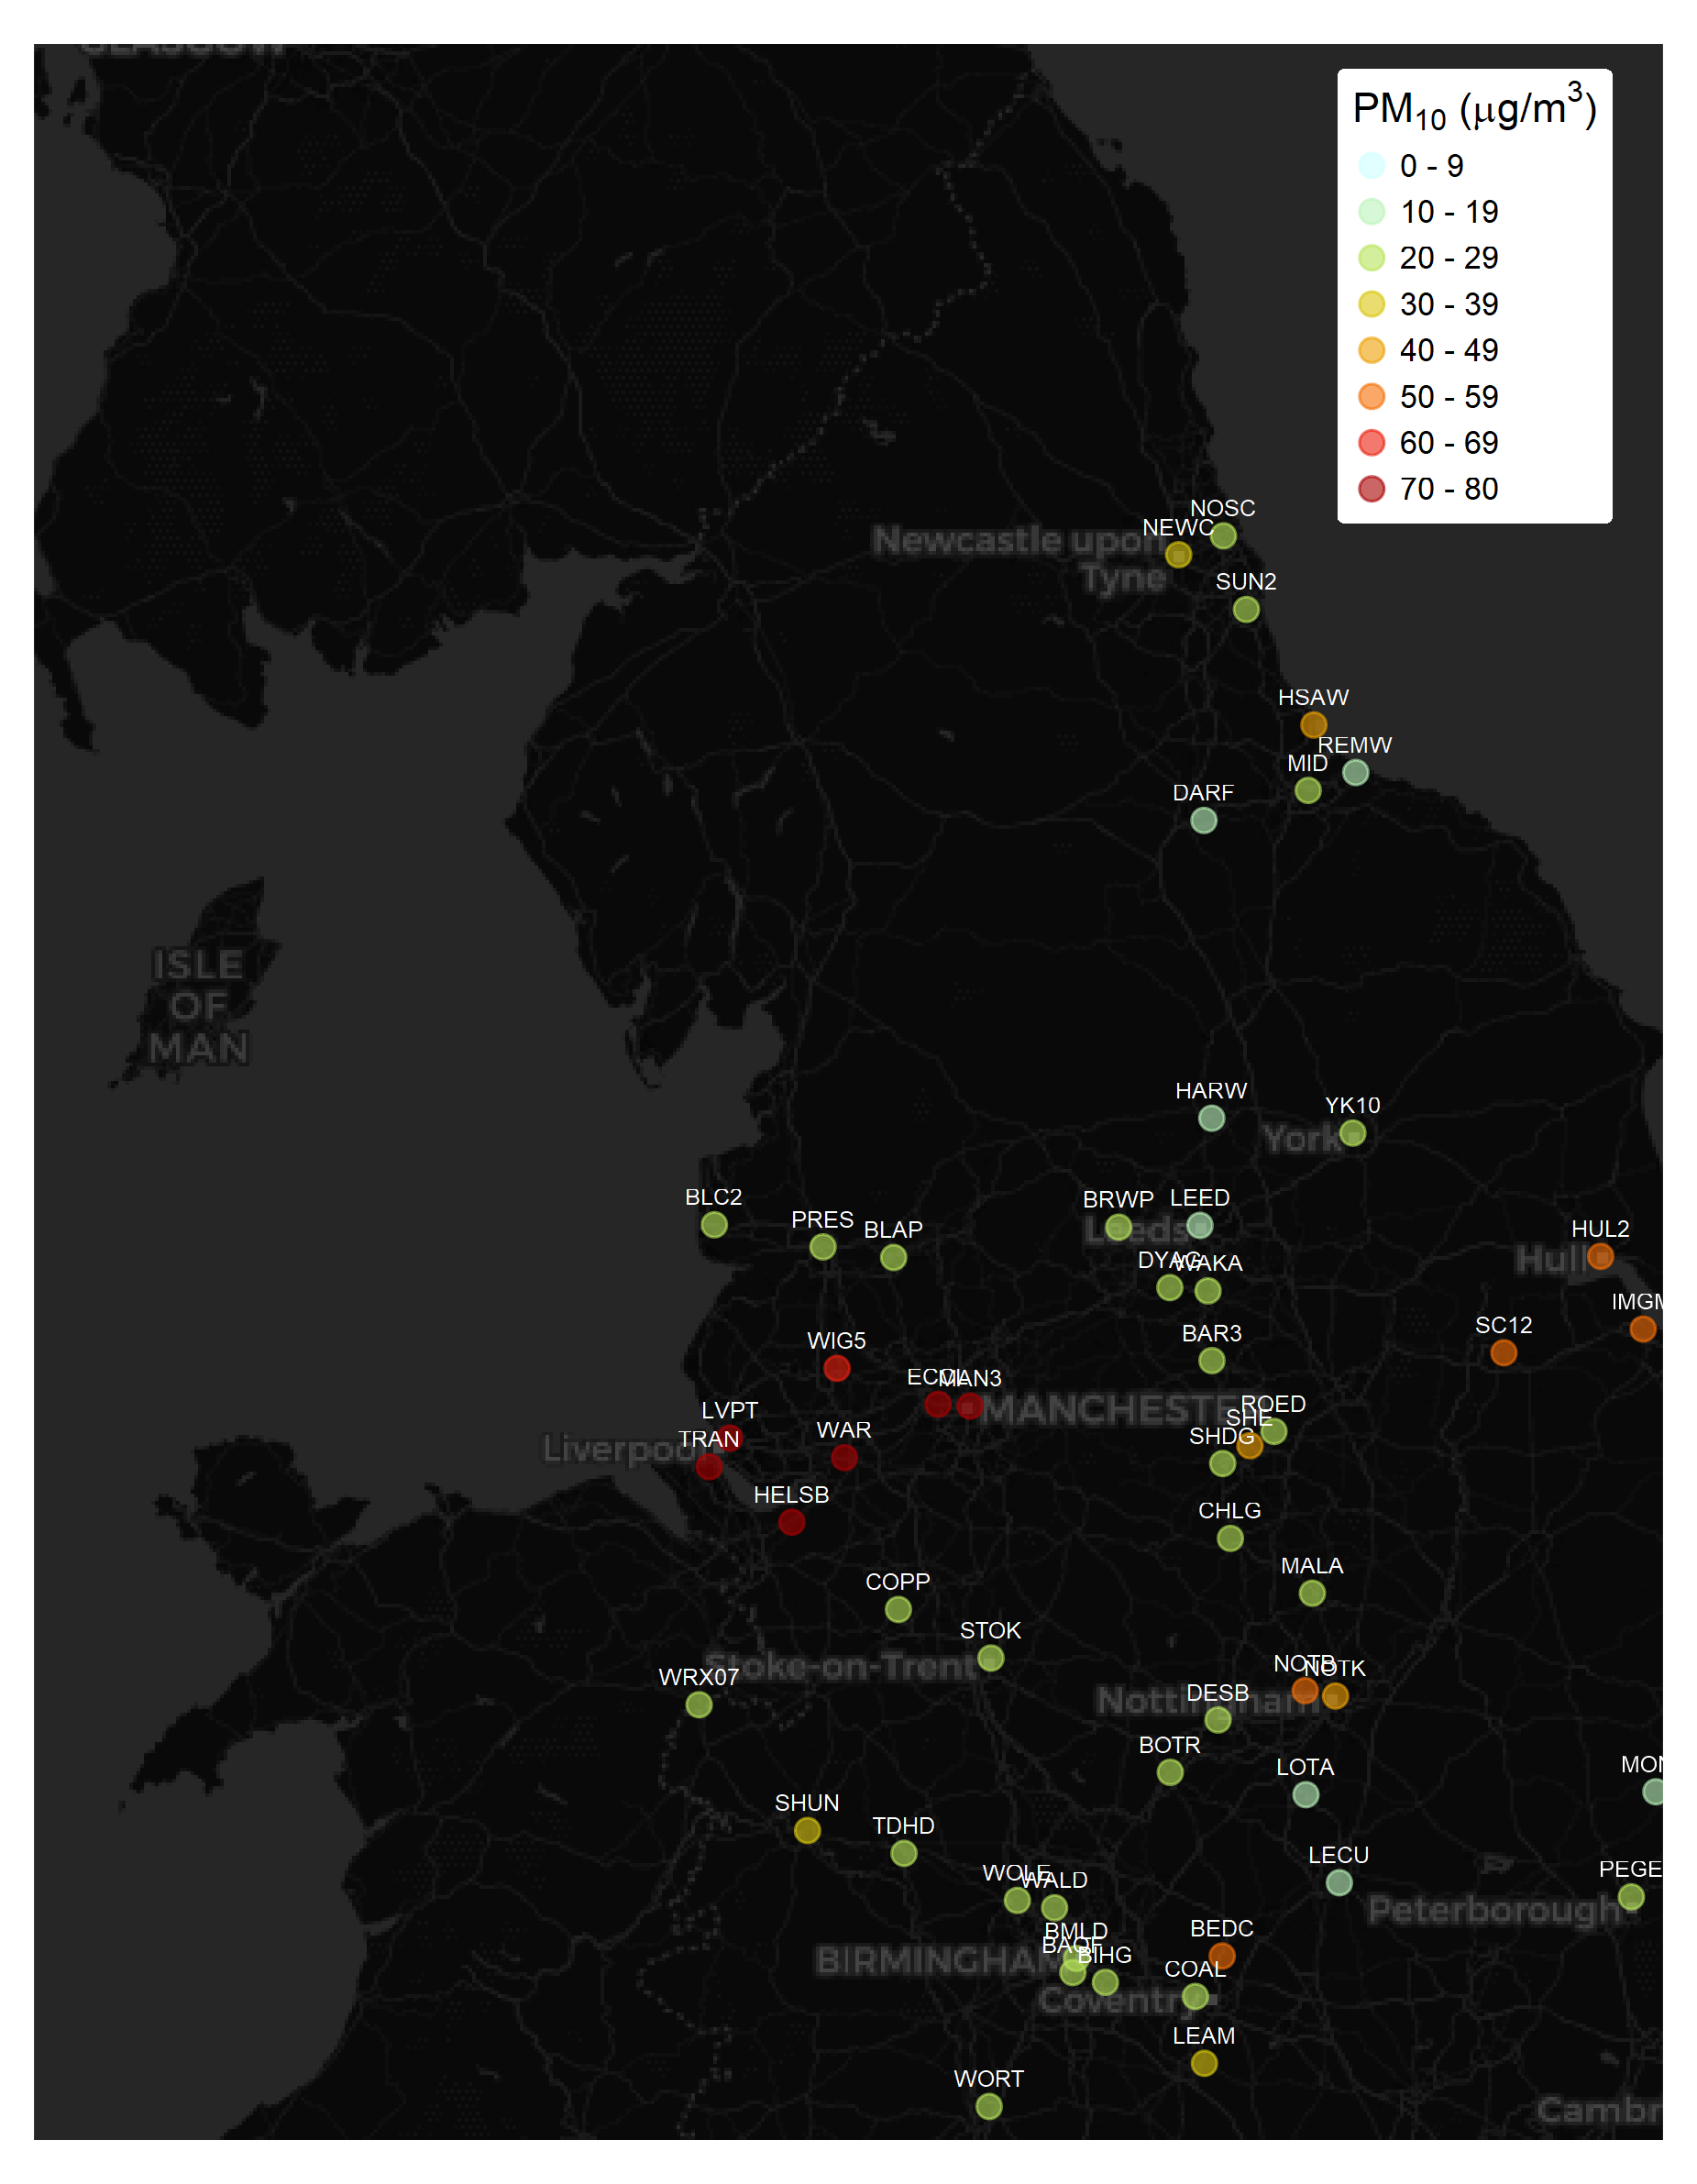
 The location of the observation sites is shown below coloured by the hourly maximum. Some of the sites have recorded over 100ug/m3 hourly max concentrations.
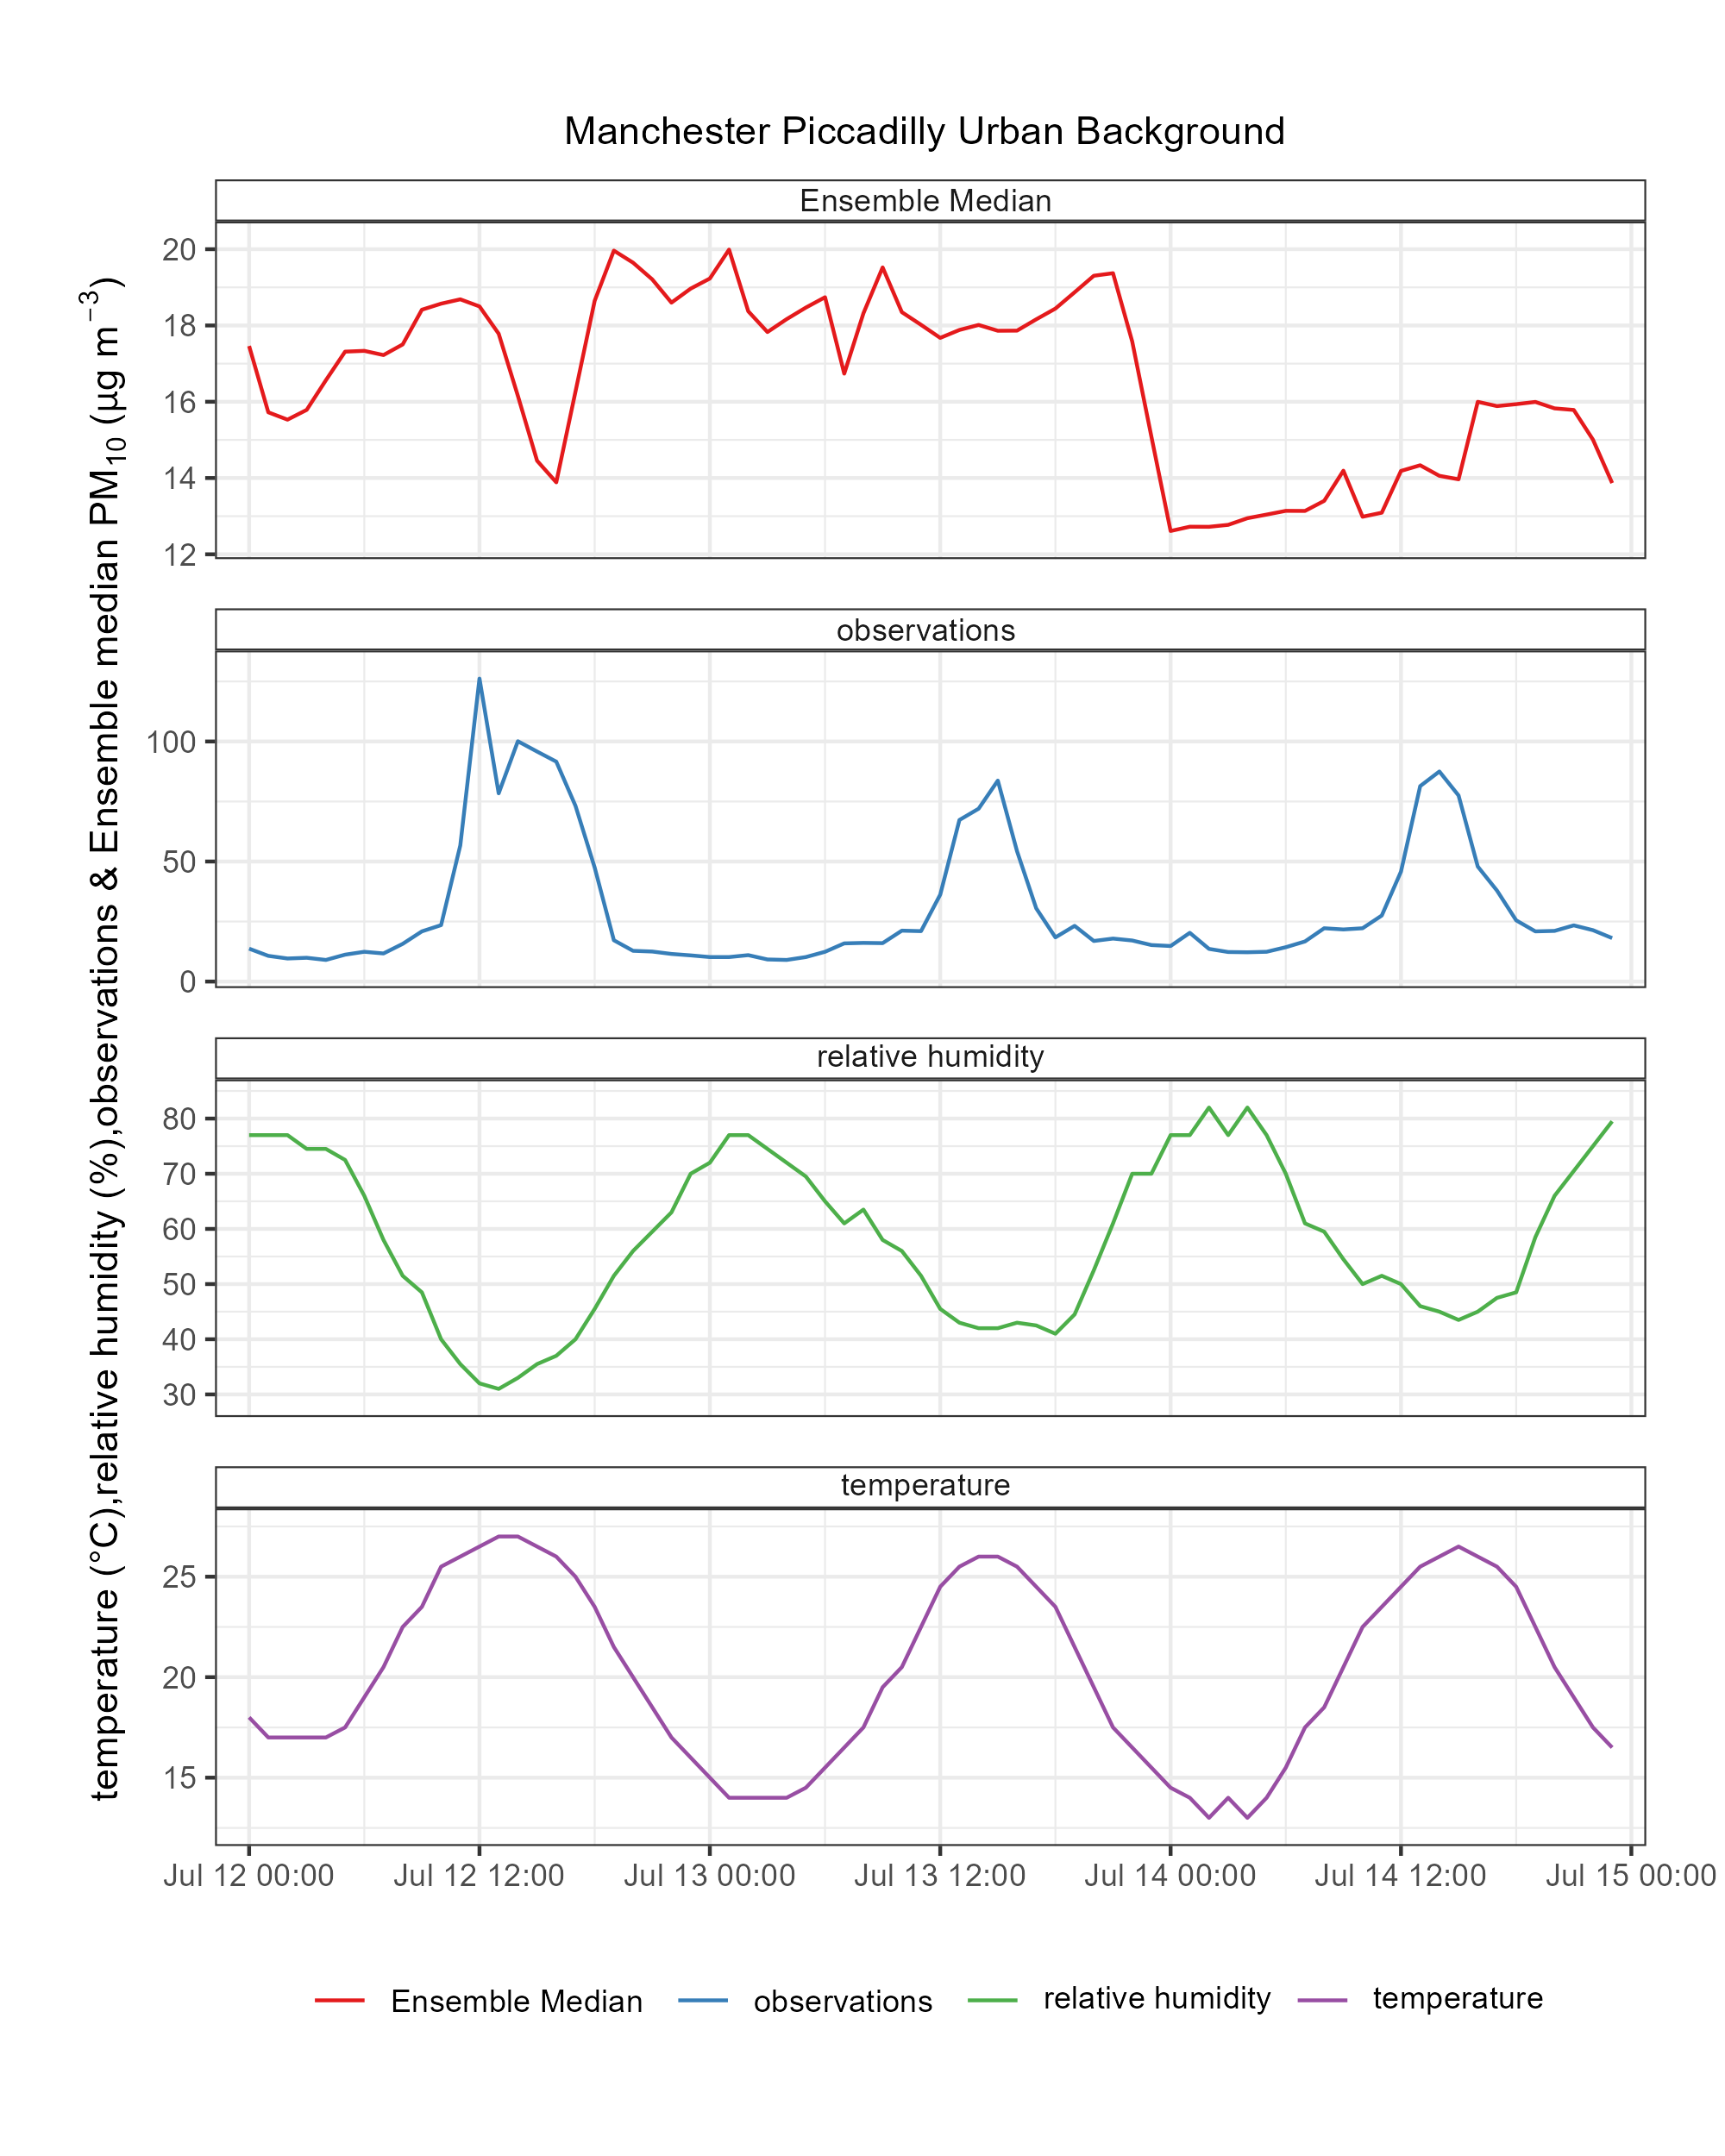
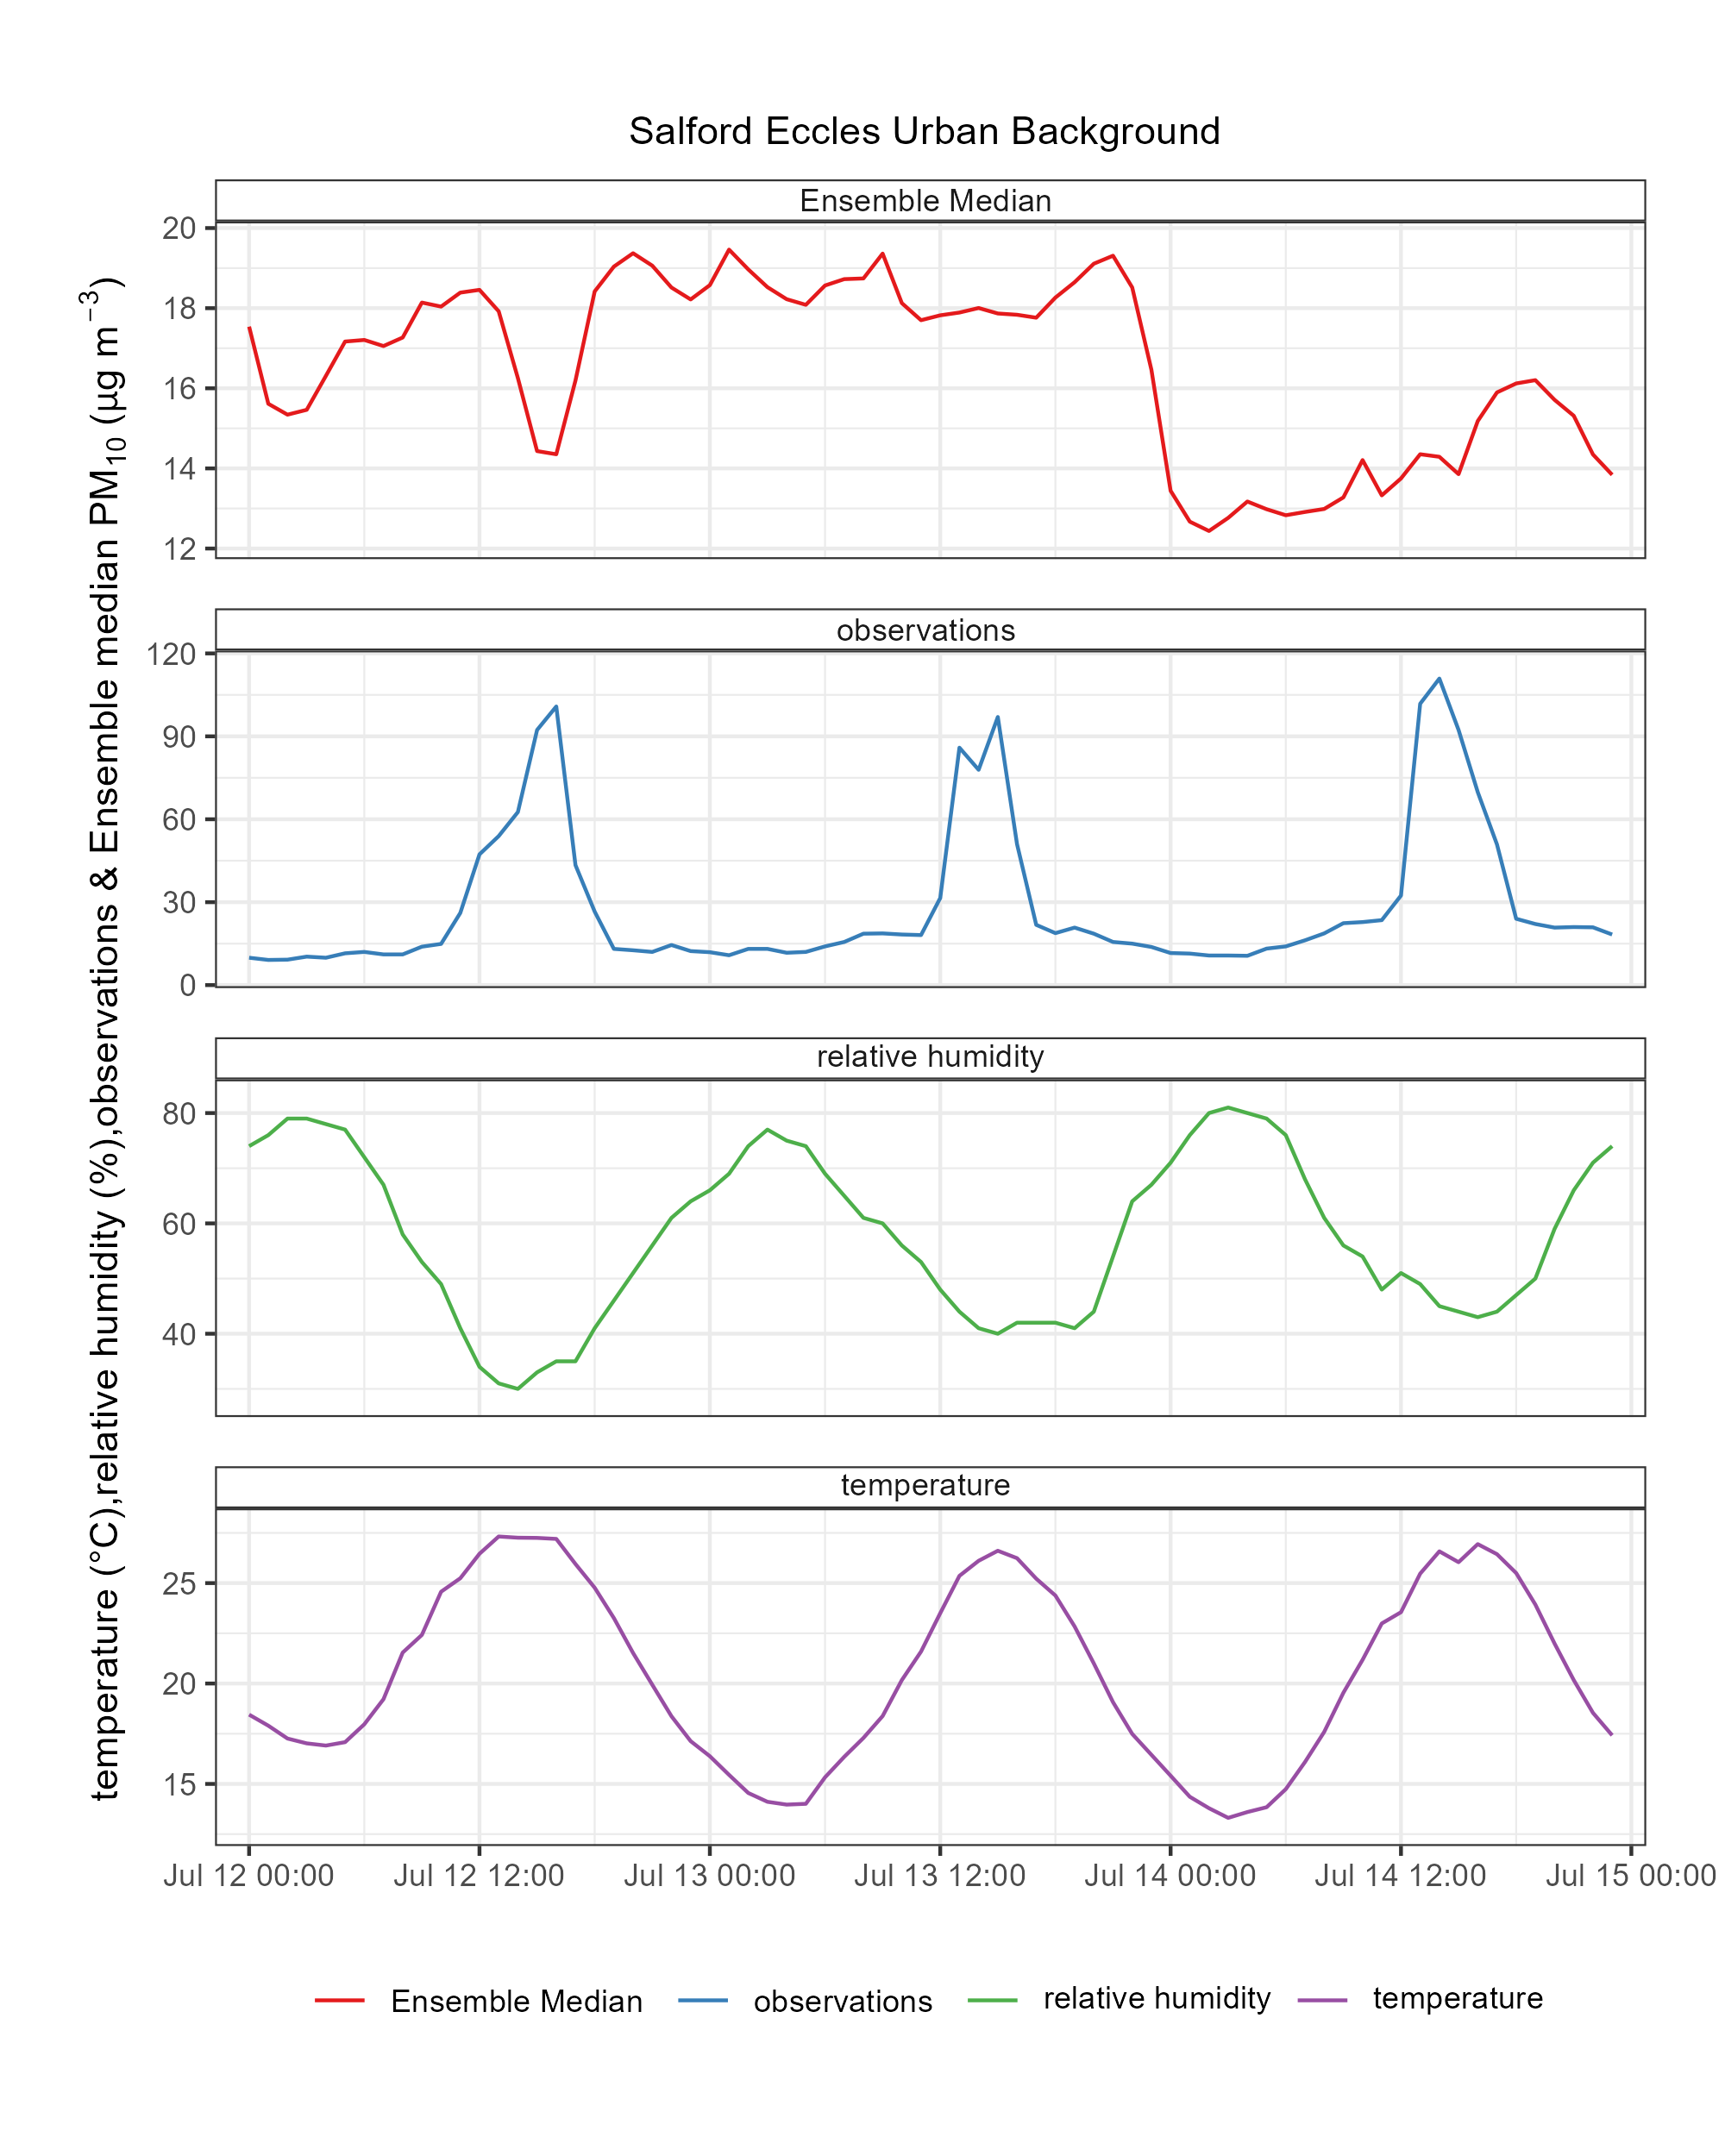
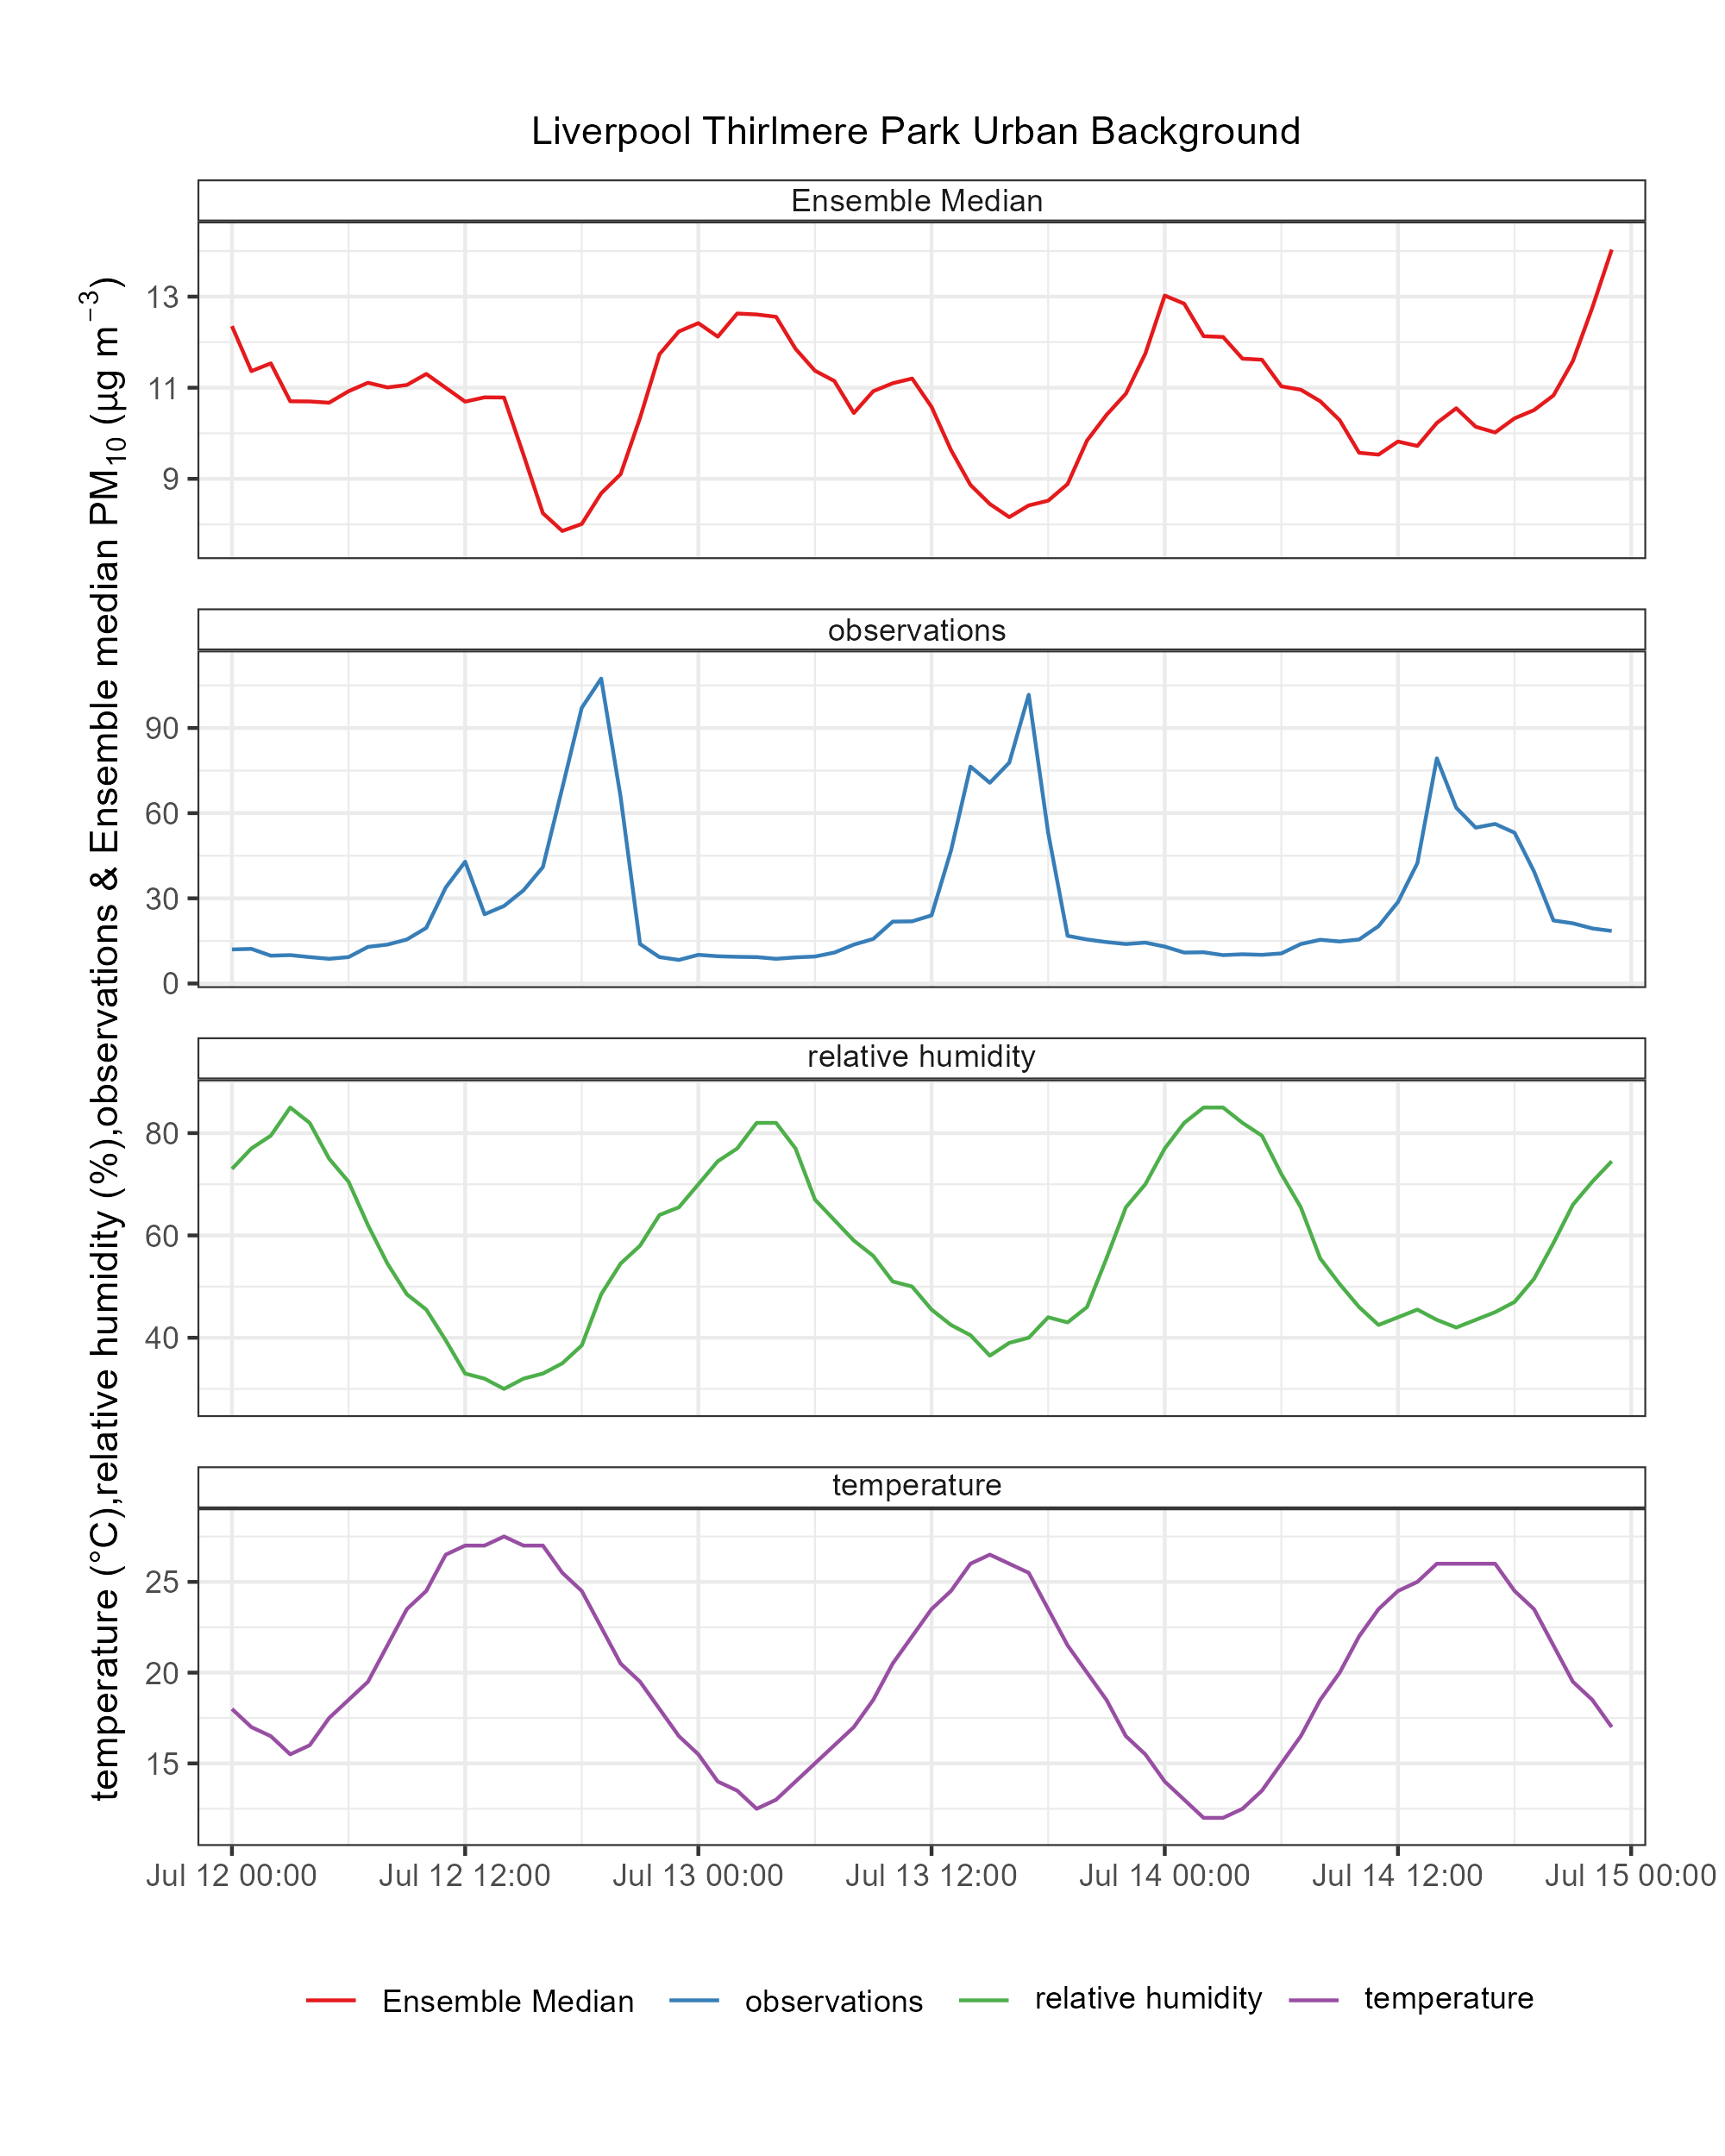
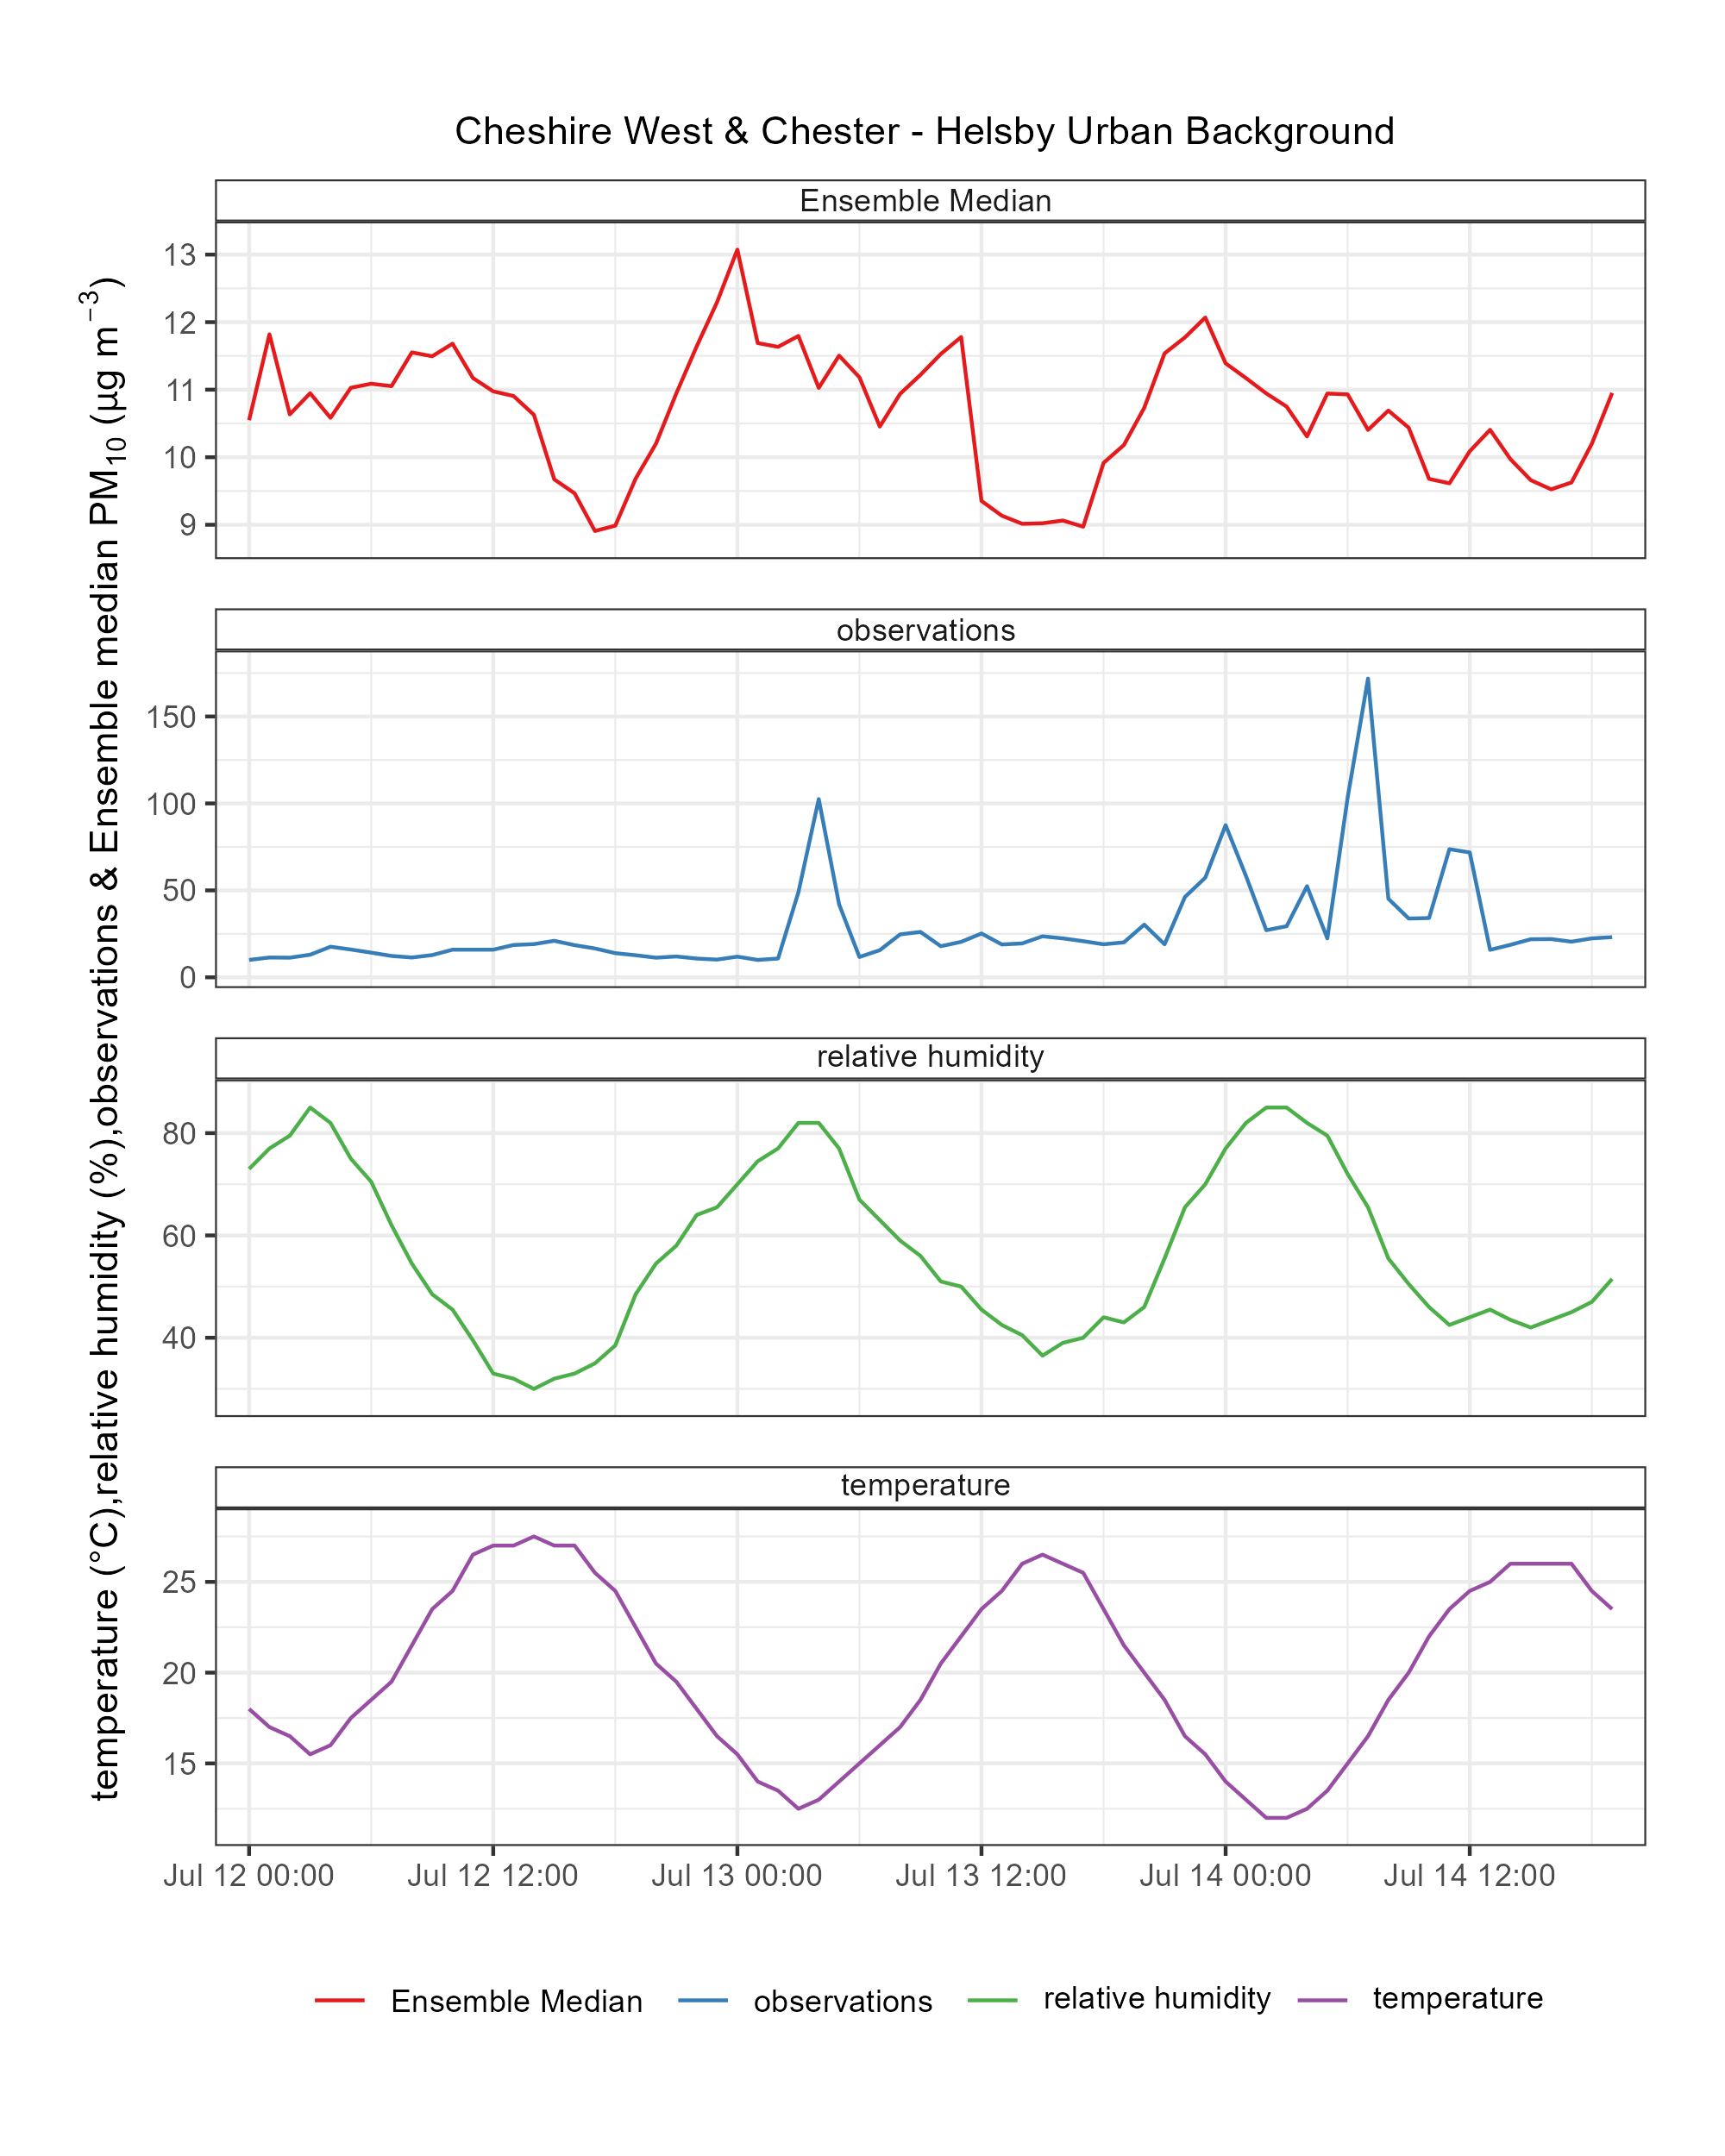
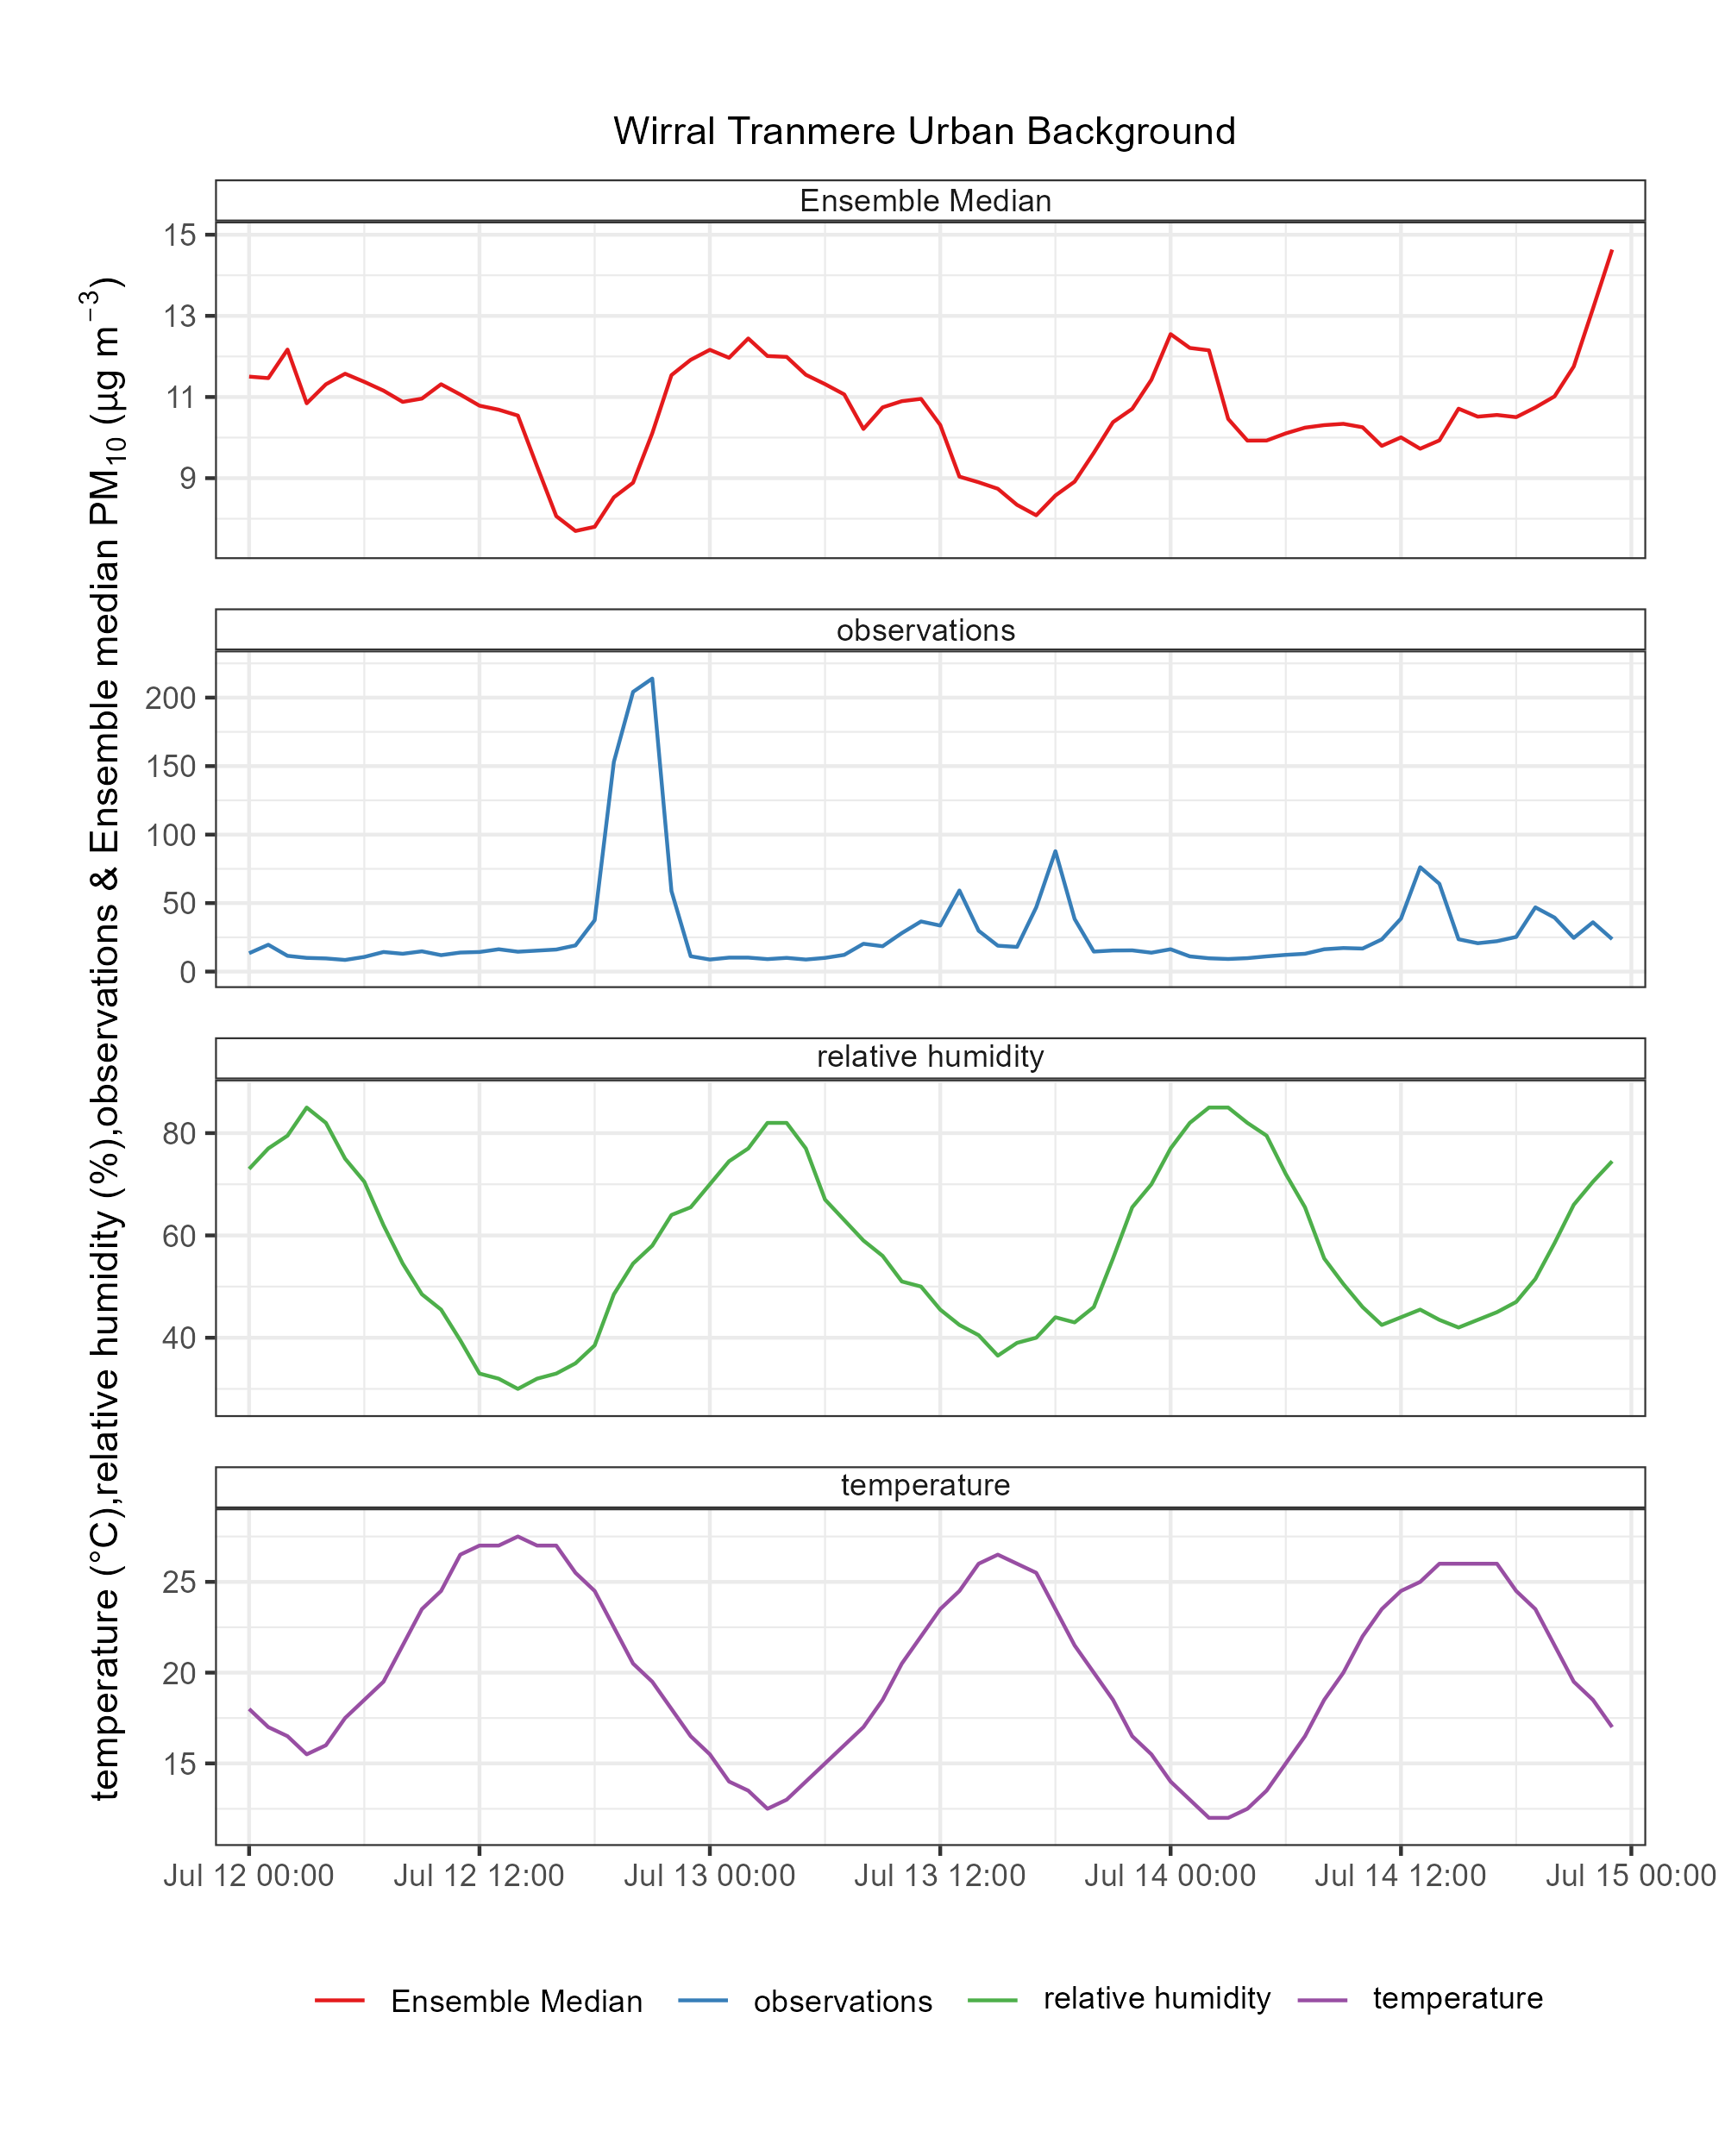
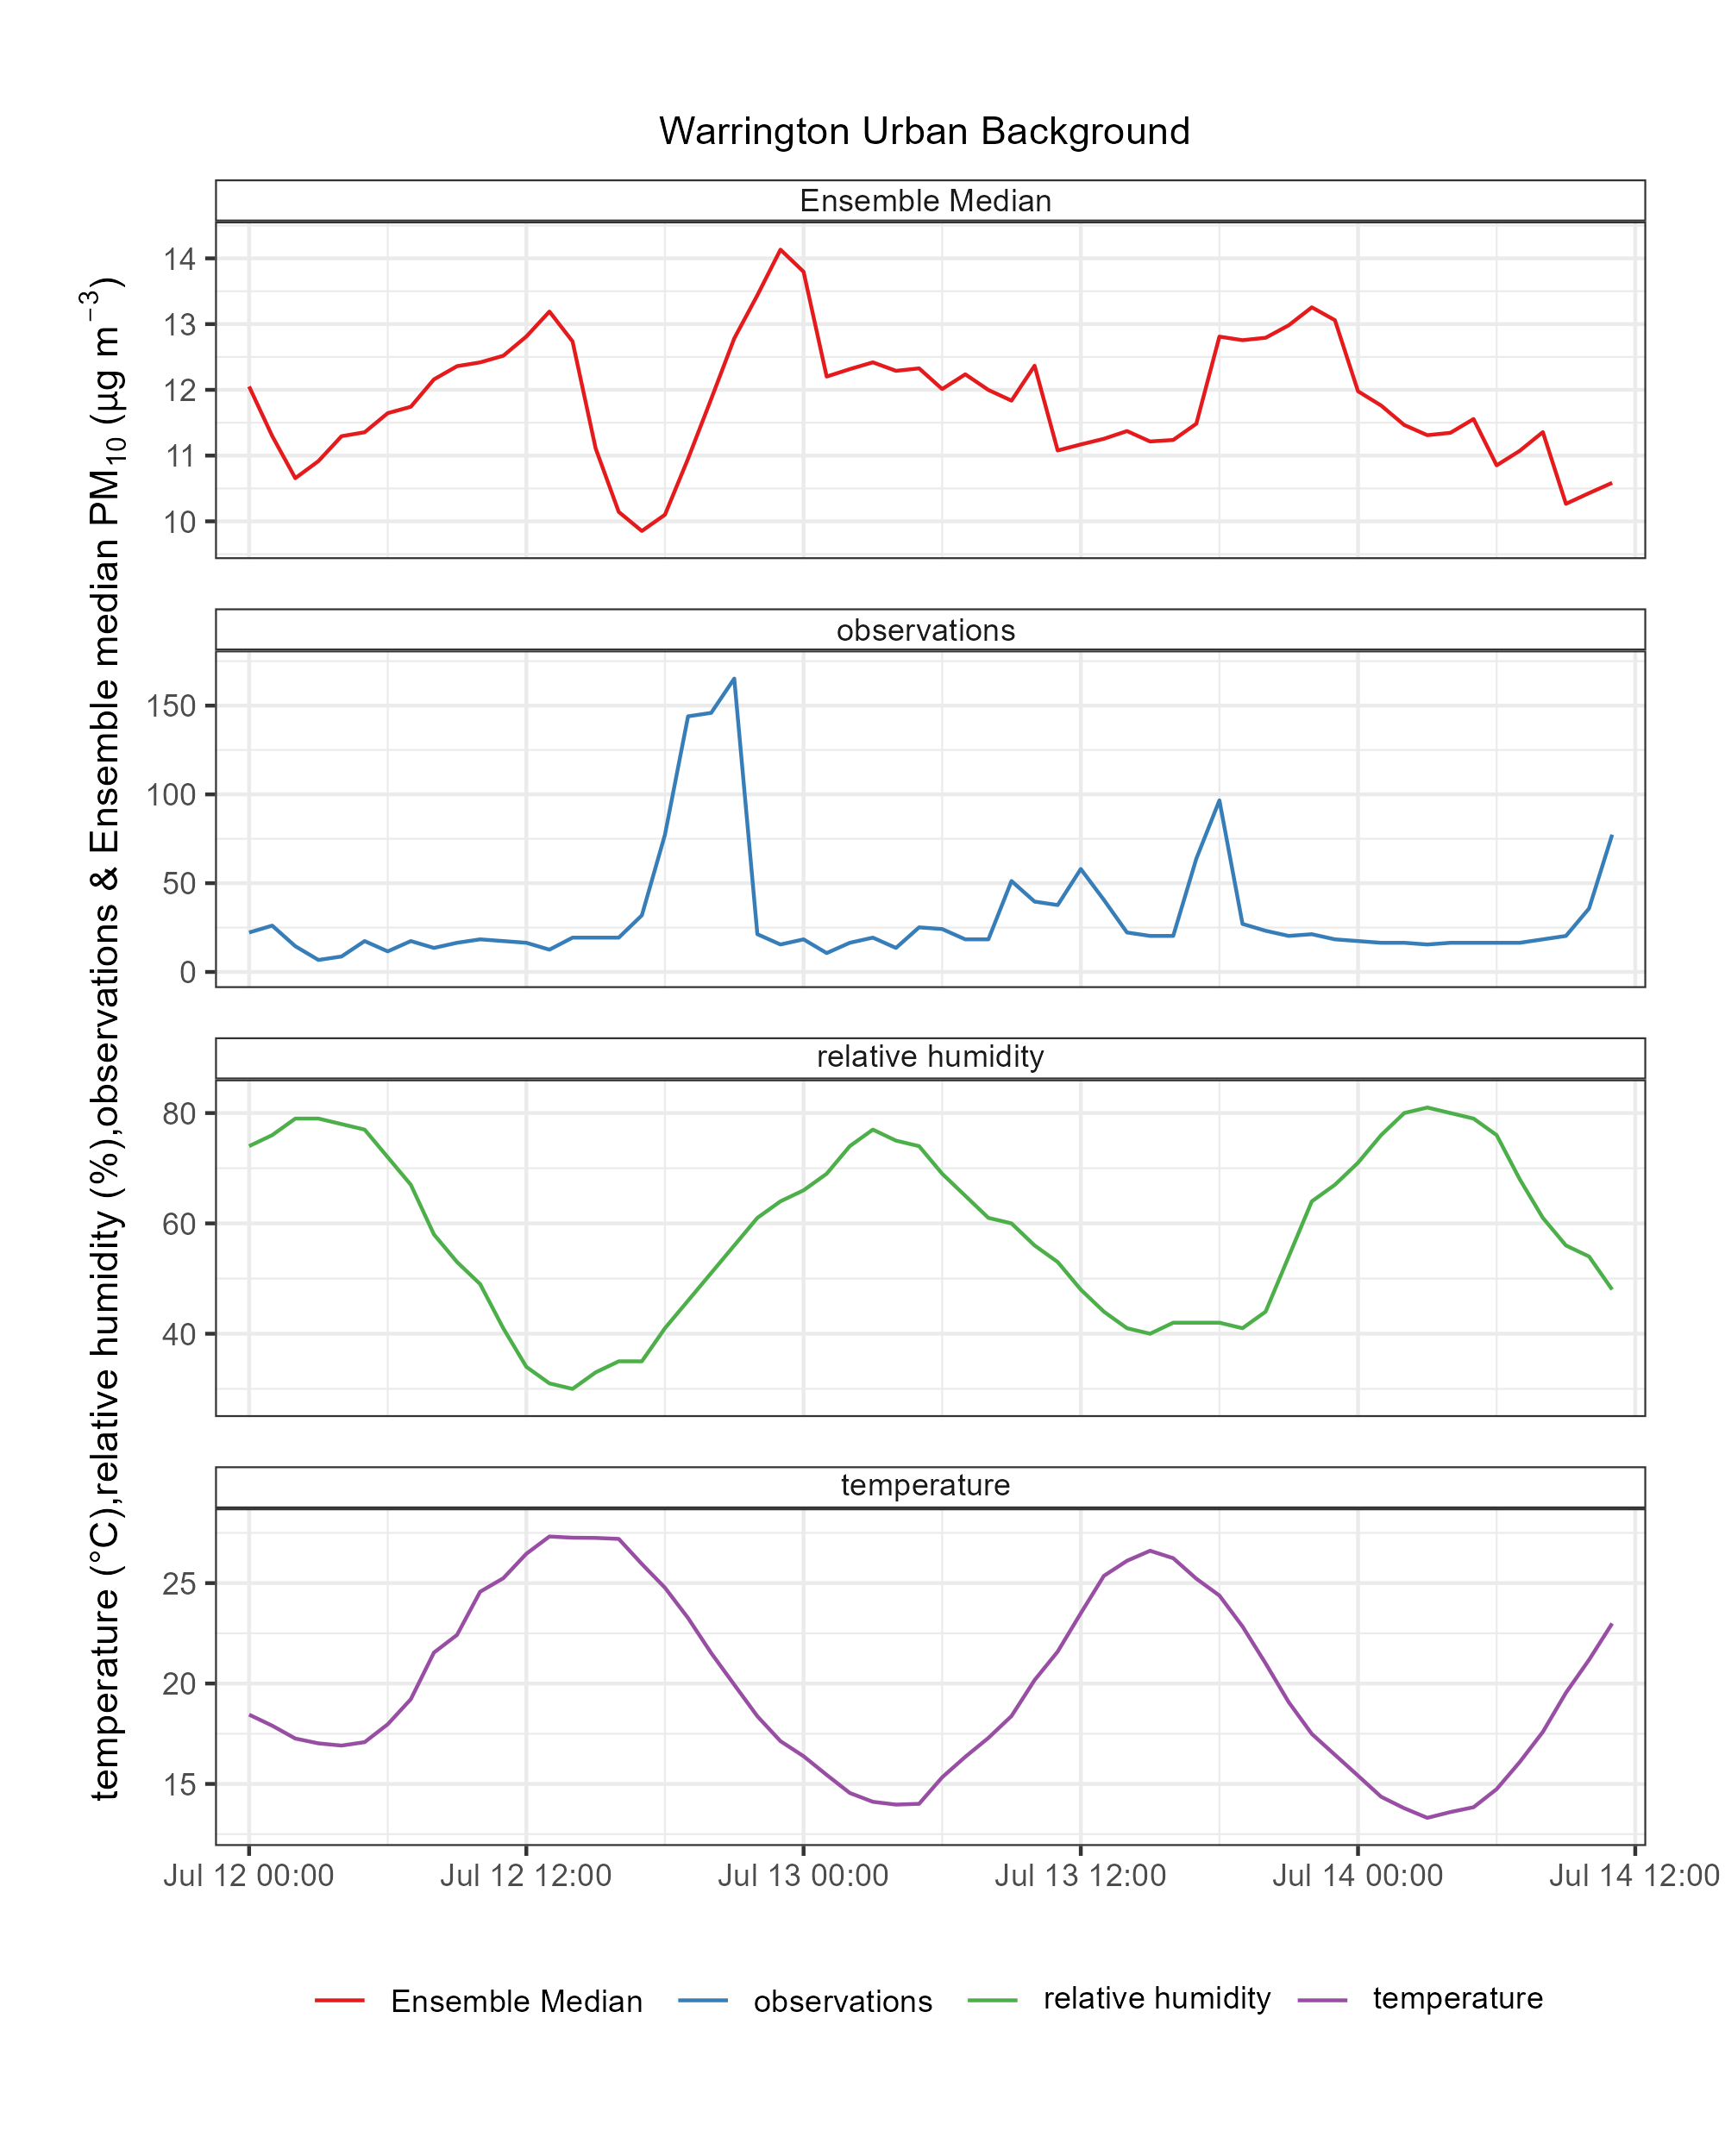
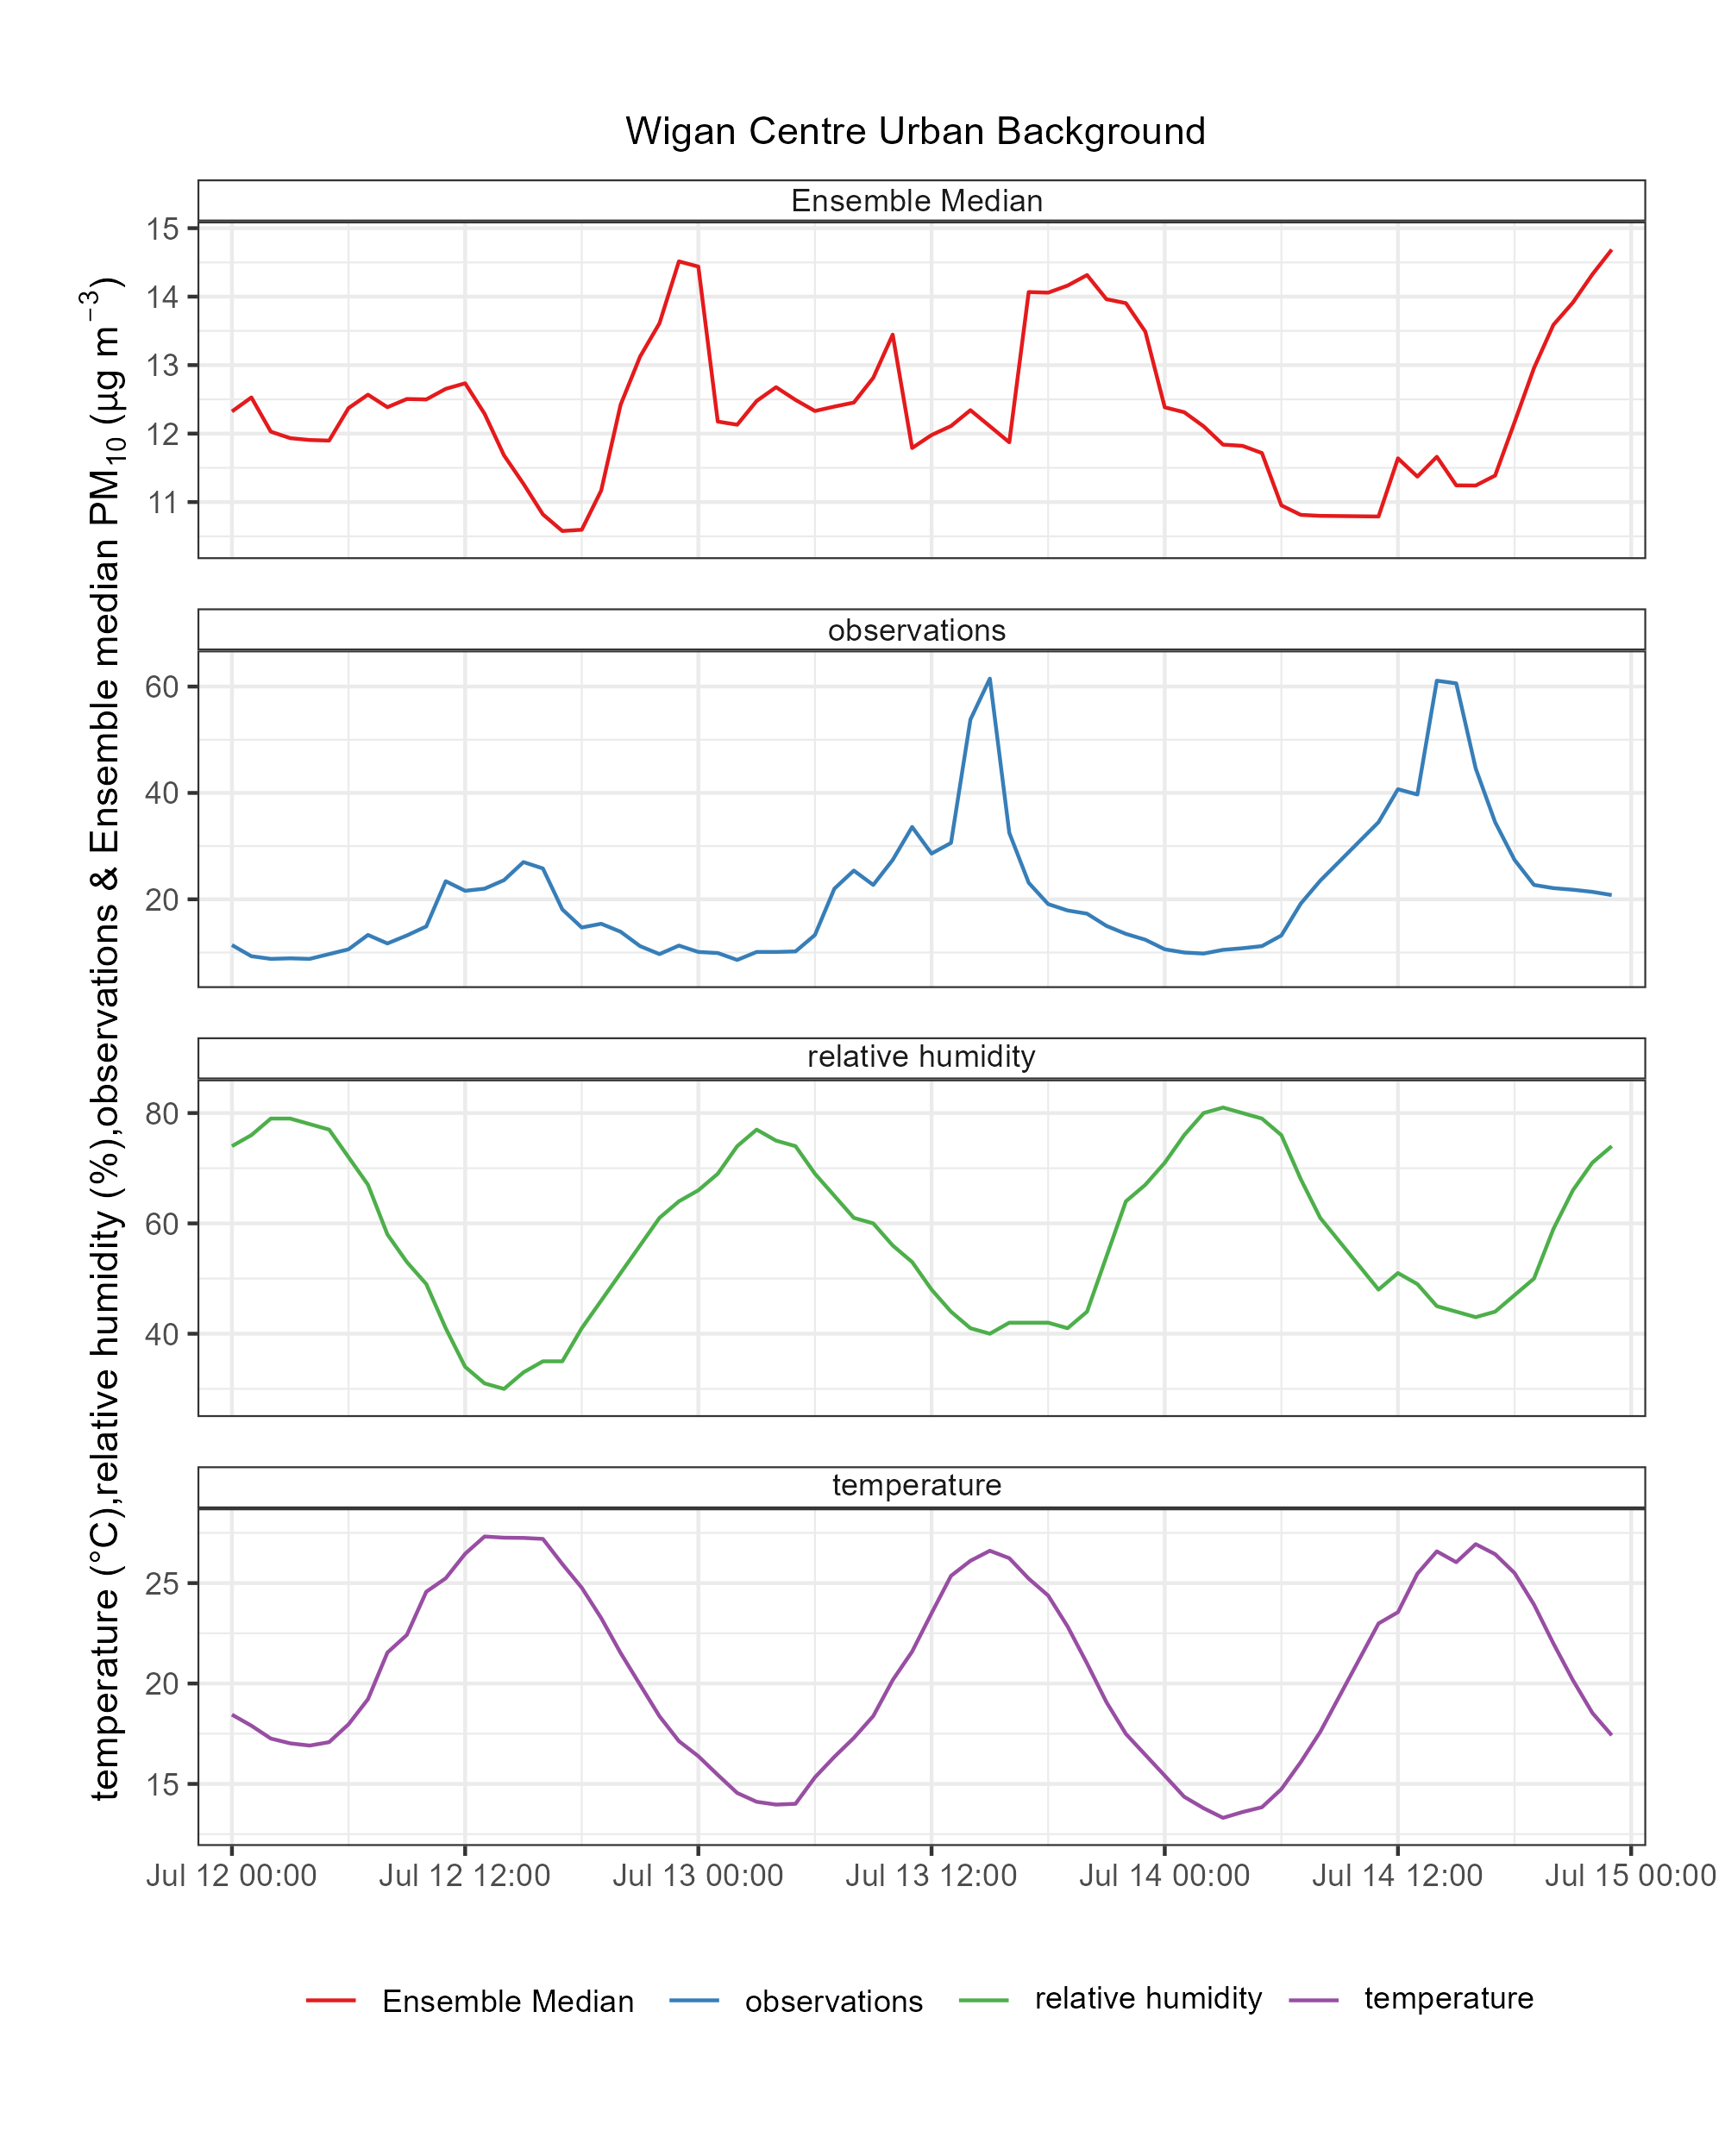
For these sites a more detailed plot is shown below, comparing the ensemble median of the models, observations along with temperature and humidity data for each site (obtained with the worldmet R package). You might expect a wildfire to produce a constant plume of smoke, but as the temperature drops and humidity rises each night the fires die down only to bounce back in the middle of the next day.
The scales of these plots have been adjusted to the data, a closer look at the scales shows not only does the modelled concentration not match the profile but the magnitude is far lower, as is seen in the animation above.