Winsley Stats19 analysis
Introduction
This report presents an examination of road collision and casualty data for the Parish of Winsley in Wiltshire, based on the UK Department for Transport’s official STATS19 database. shown by the orange line in the figure below.
The analysis covers the period 2010 to 2024, chosen because this is the range for which corresponding cost data cost data are available.
The underlying dataset comprises three linked tables collected via the STATS19 system:
Collision Data: Information about each recorded incident, including location, environmental conditions, and road characteristics.
Casualty Data: Records of everyone injured or killed in collisions, detailing injury severity, age, and sex.
Vehicle Data: Characteristics of vehicles involved in collisions. Note: vehicle data were not included in the main analysis for this report.
All three tables are connected through a unique identifier called the collision index, enabling linked summaries of collisions and casualties for analysis.
Where fractional counts (e.g., 0.8 Serious, 0.2 Slight) appear in the charts and tables, this reflects the use of the MAIS 3+ score to retrospectively reclassify injury severity. This adjustment allows for fairer comparisons over time and between countries, aligning with international approaches such as those used by the World Health Organization, which typically focus on fatal collisions due to variations in reporting practices across regions.
All results shown here — including numbers, charts, maps, and cost summaries — can be reproduced using the analysis.R script available in the project repository. Many of the Serious and Slight figures might be shown as decimals, i.e. 0.8 Serious and 0.2 Slight. This is because injuries are reclassified retrospectively according to the to enable fair comparisons between casualties and also enable comparisons between countries (e.g. the WHO only considers fatal collisions in its reporting because so many countries don’t report serious and slight injuries due to difficulties in documentation training etc.).
Trends in Casualties (2010–2024)
The first section assesses trends in road casualties over time.
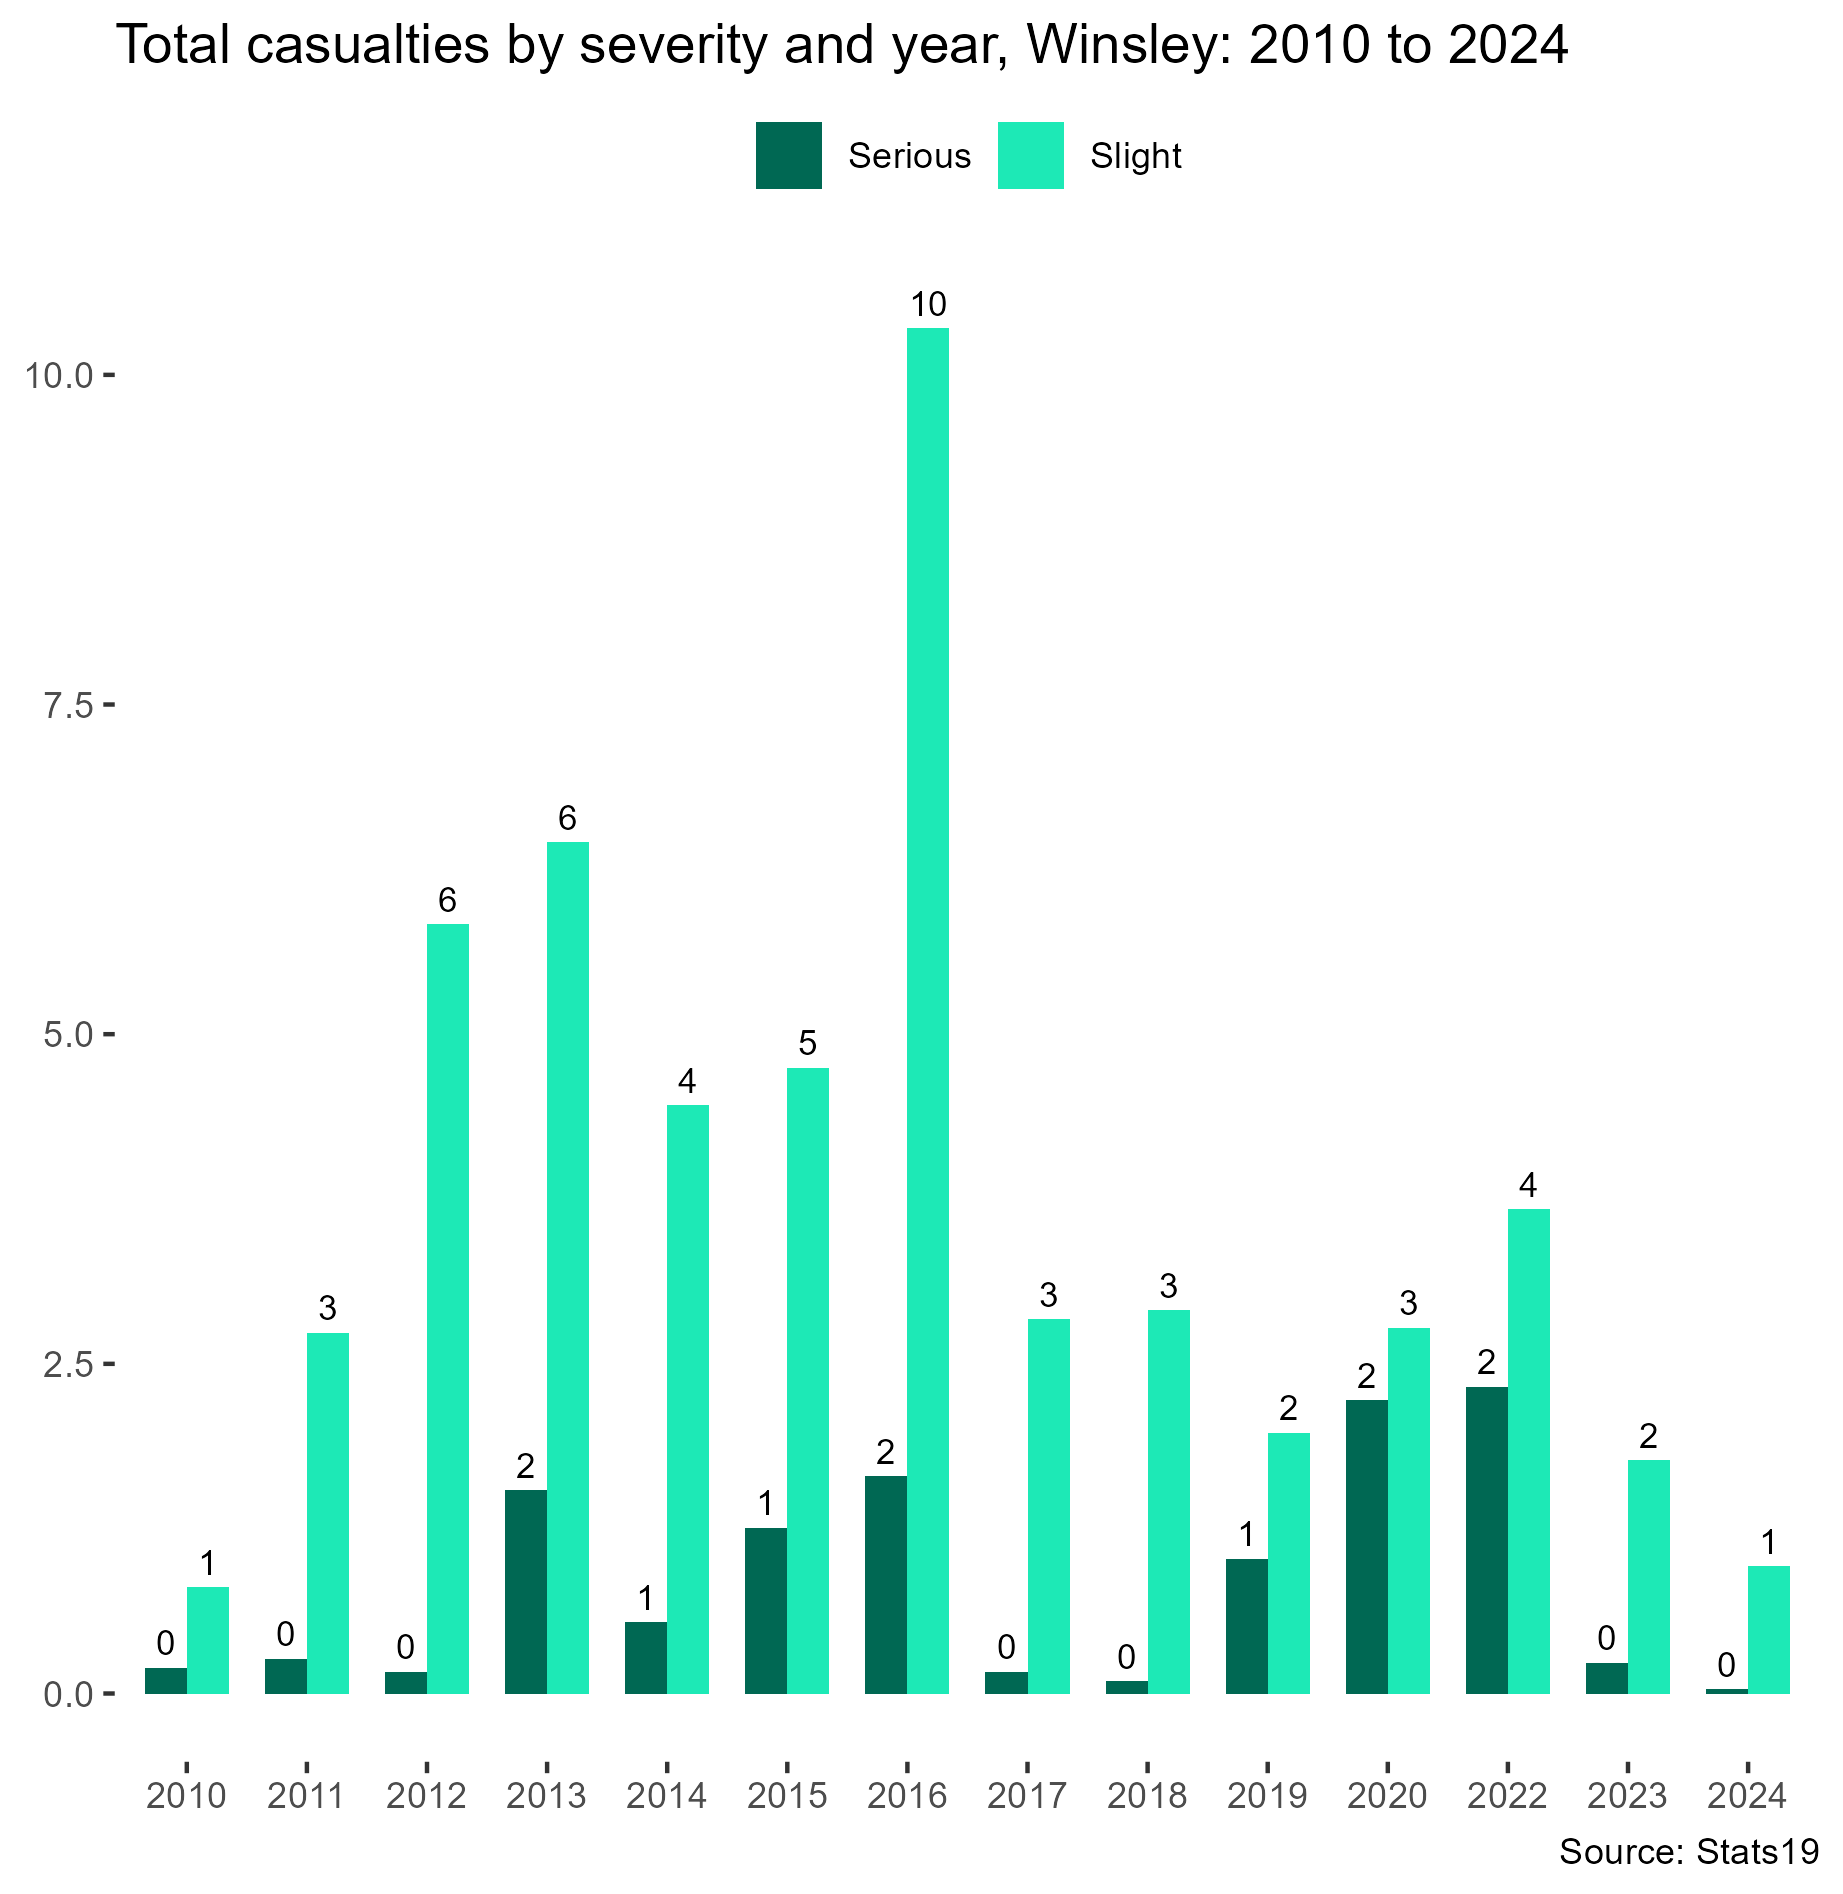
Total Casualties and Severity
Between 2010 and 2024, the overall number of reported casualties in Winsley is summarised by severity levels (fatal, serious, slight). The time-series chart displays yearly totals.
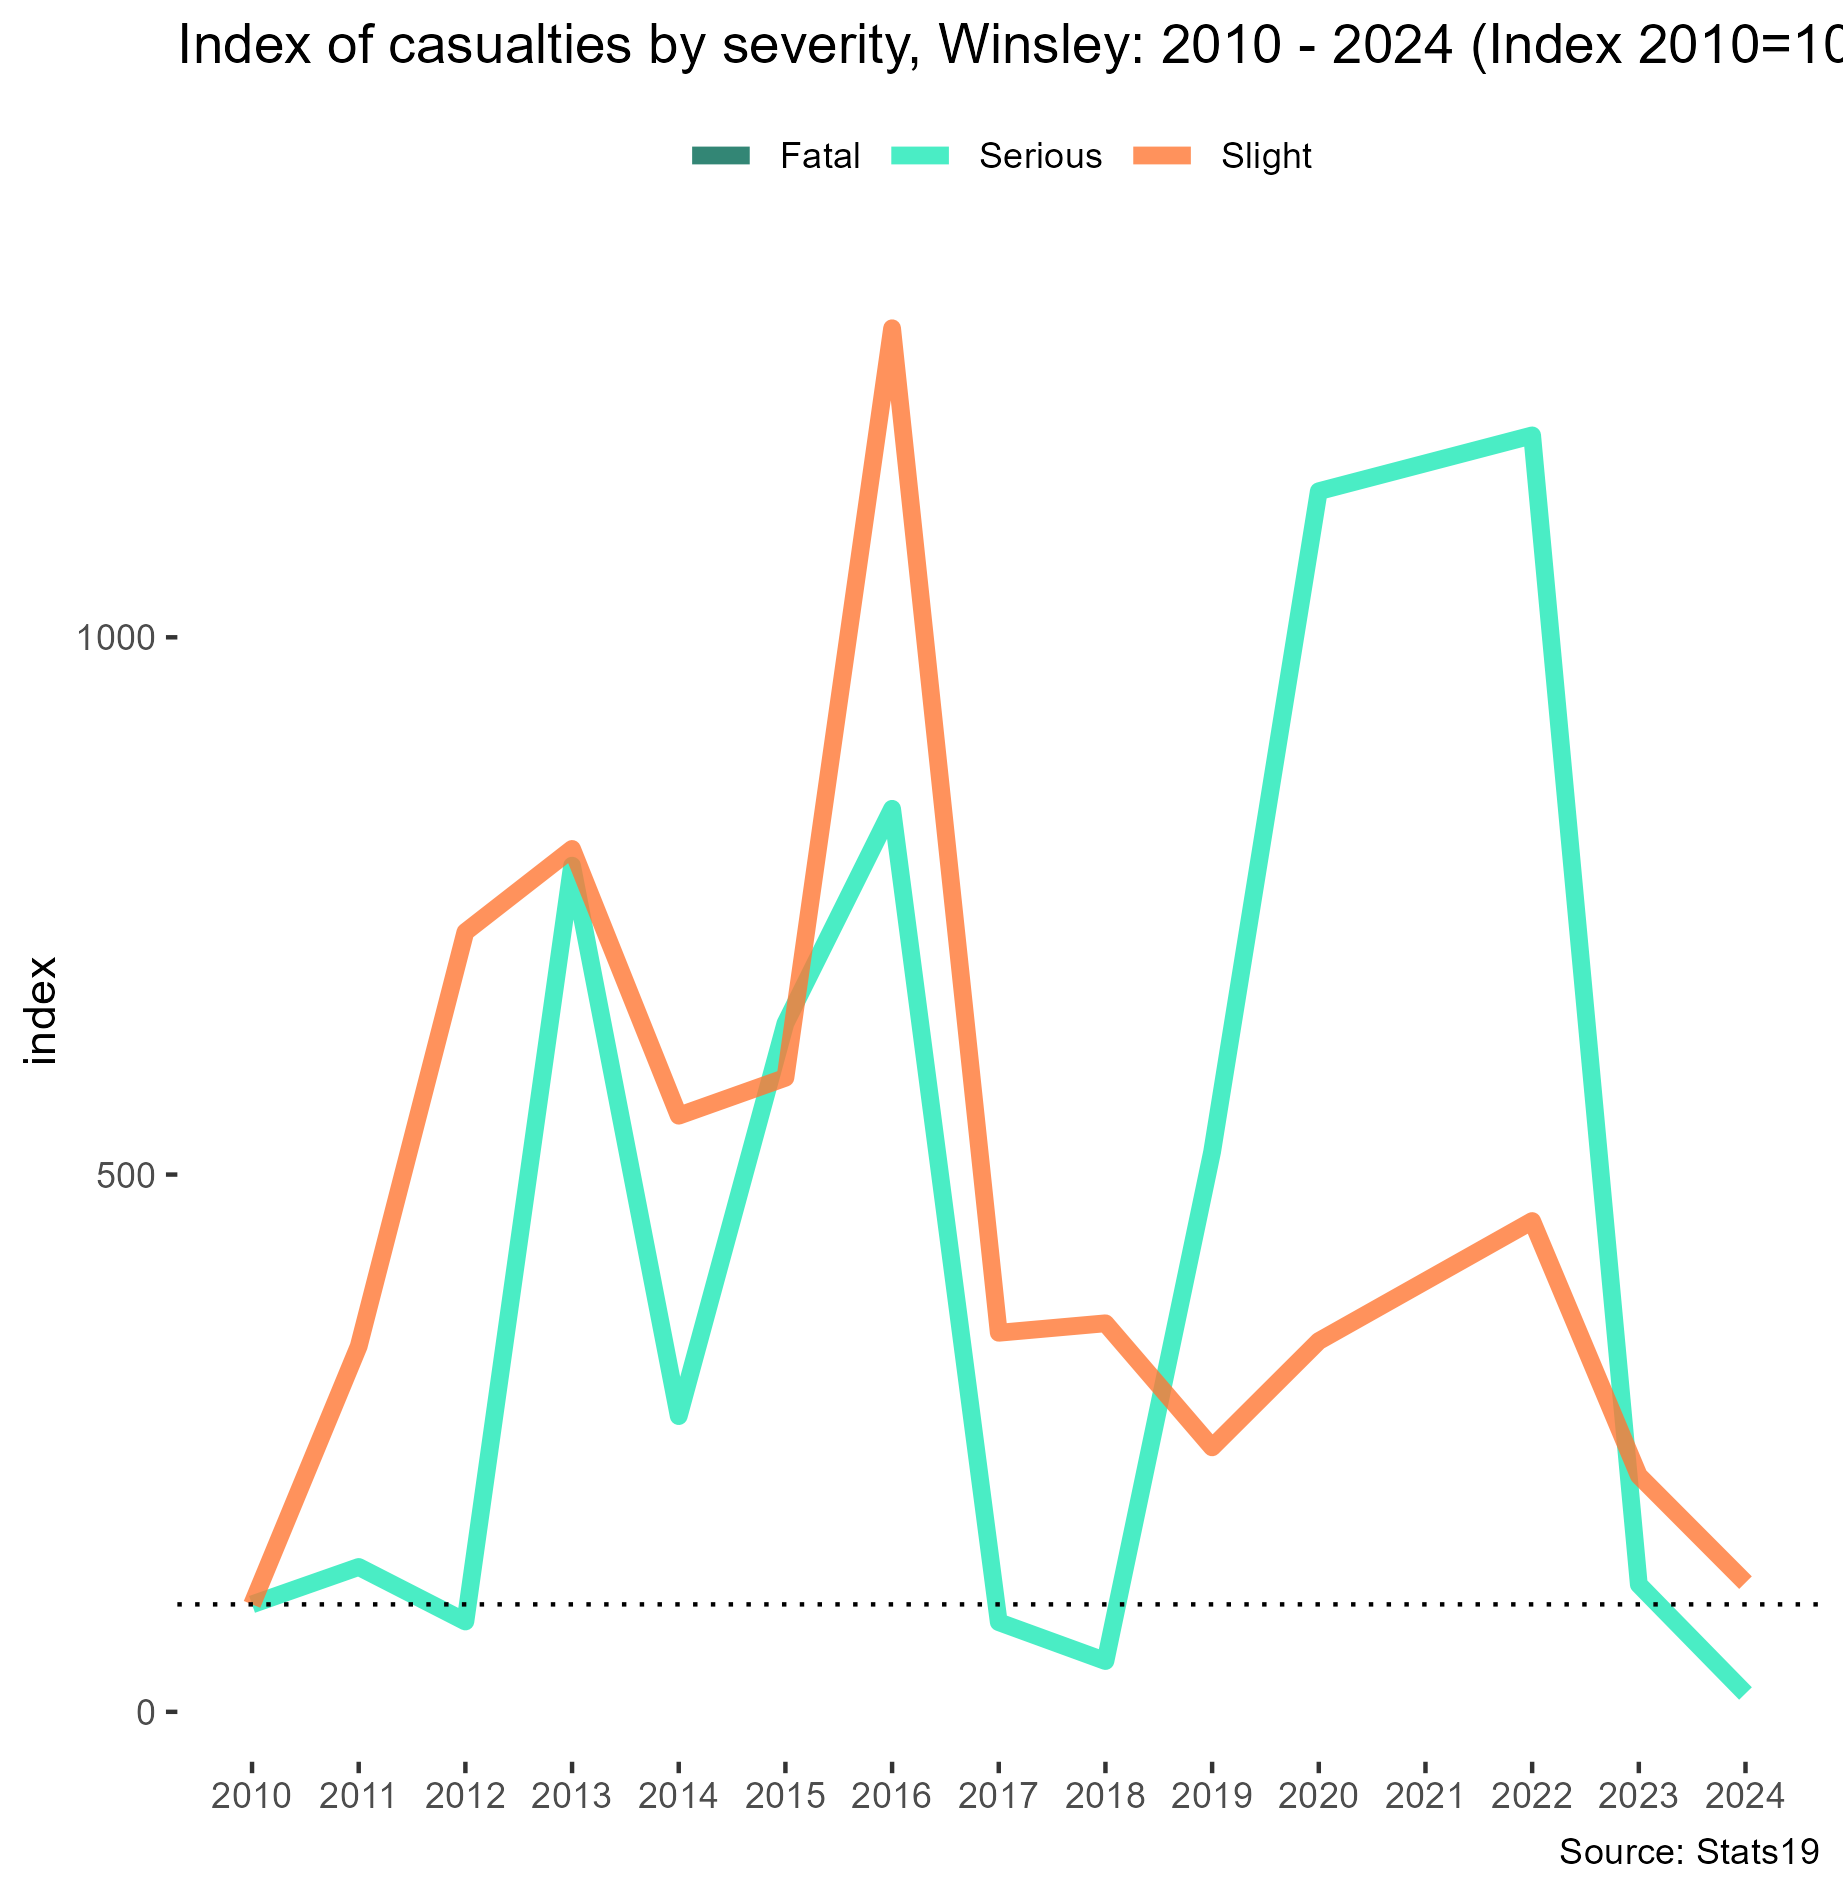
The change in annual casualties relative to the baseline year 2010. This allows us to see whether the number and severity of casualties are increasing, decreasing, or stable over this 15-year period.
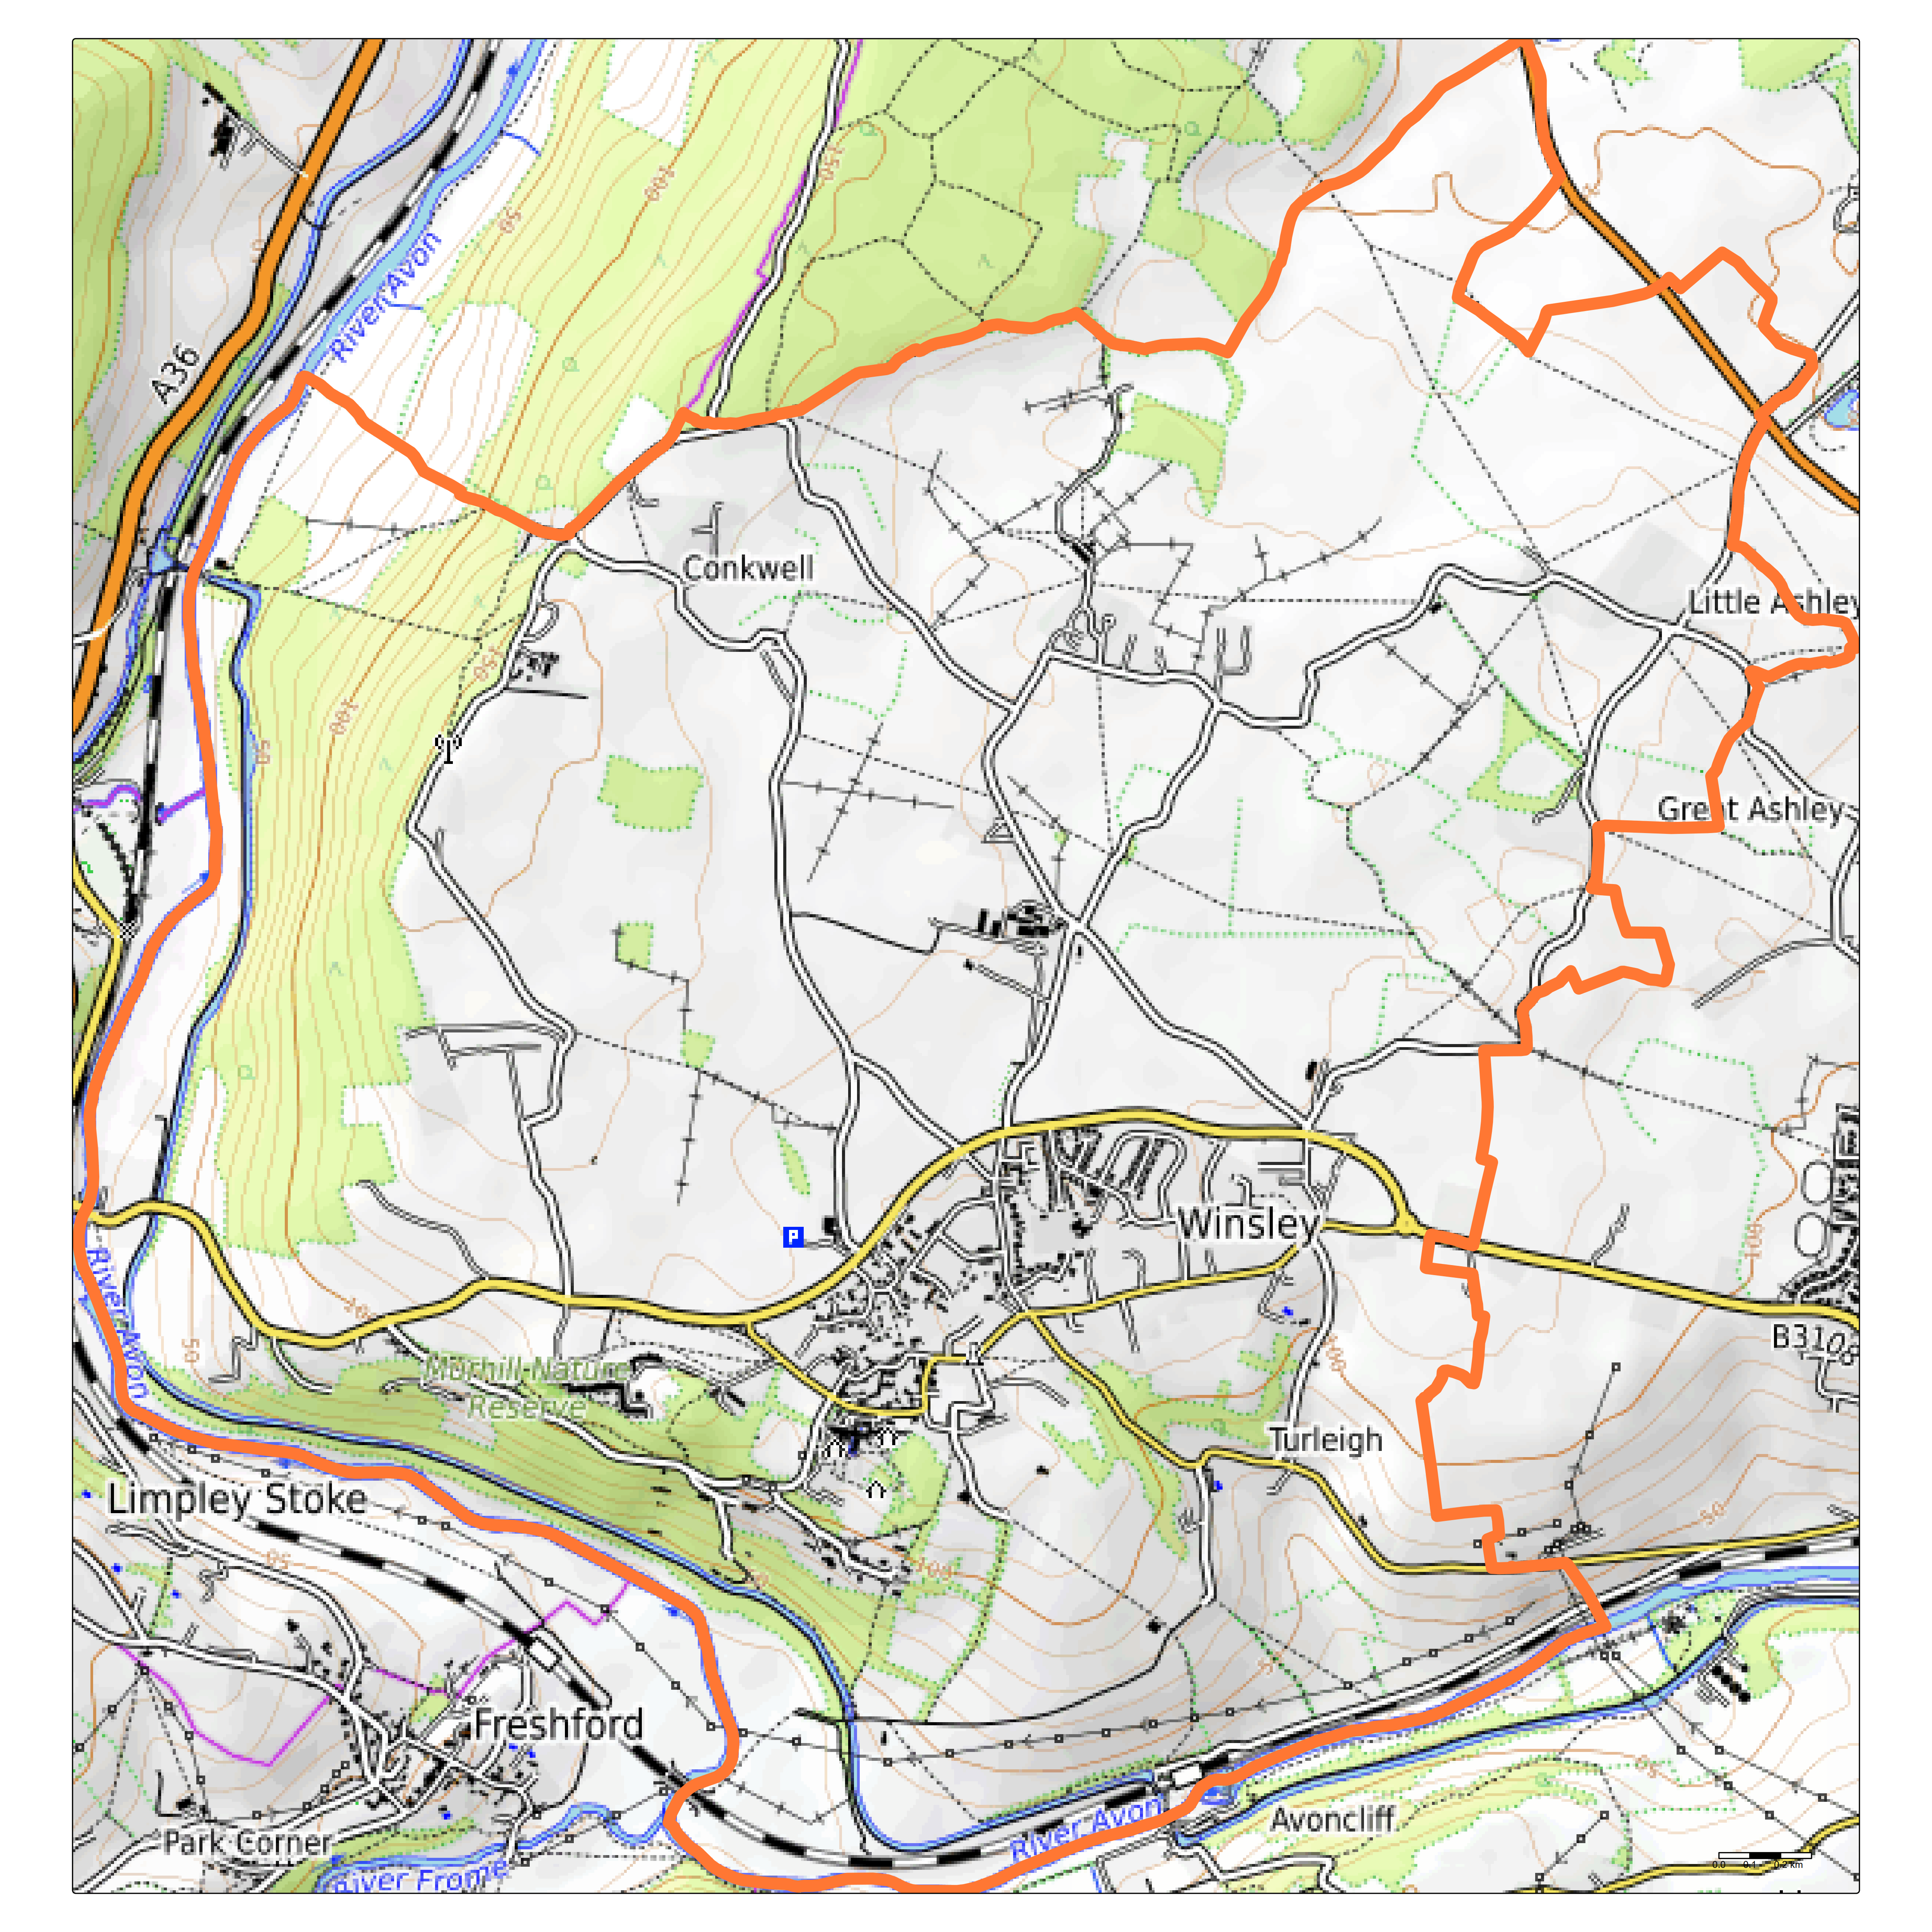
Where Collisions are Happening (Location)
The next part visualises the spatial distribution of collisions within Winsley.
Casualty locations are plotted on a map.
Different casualty types are shown with distinct symbols and colours to help differentiate severity and type.
A second map sizes points by severity to highlight where serious and slight injuries are clustered.
These maps reveal local hotspots where collisions occur and provide insight into whether particular parts of the parish experience higher incidence or more severe outcomes.
 And the same plot as above but sized by severity.
 All the casualties OSM links
Economic Impact: DfT Avoided Cost Analysis
The Department for Transport (DfT) also publishes economic estimates for preventing road casualties and collisions, known as the RAS4001 dataset. This model calculates the monetary cost of collisions based on:
Human costs (pain, suffering, loss of life),
Medical and rehabilitation costs,
Lost economic output,
Property damage.
This dataset combines STATS19 collision records with cost values from the TAG data book, adjusted regularly for inflation and changes in data recording.
The values in the table RAS4001 have been matched with the casualty data for the period 2010-2024 and summarised in the table and plot below.
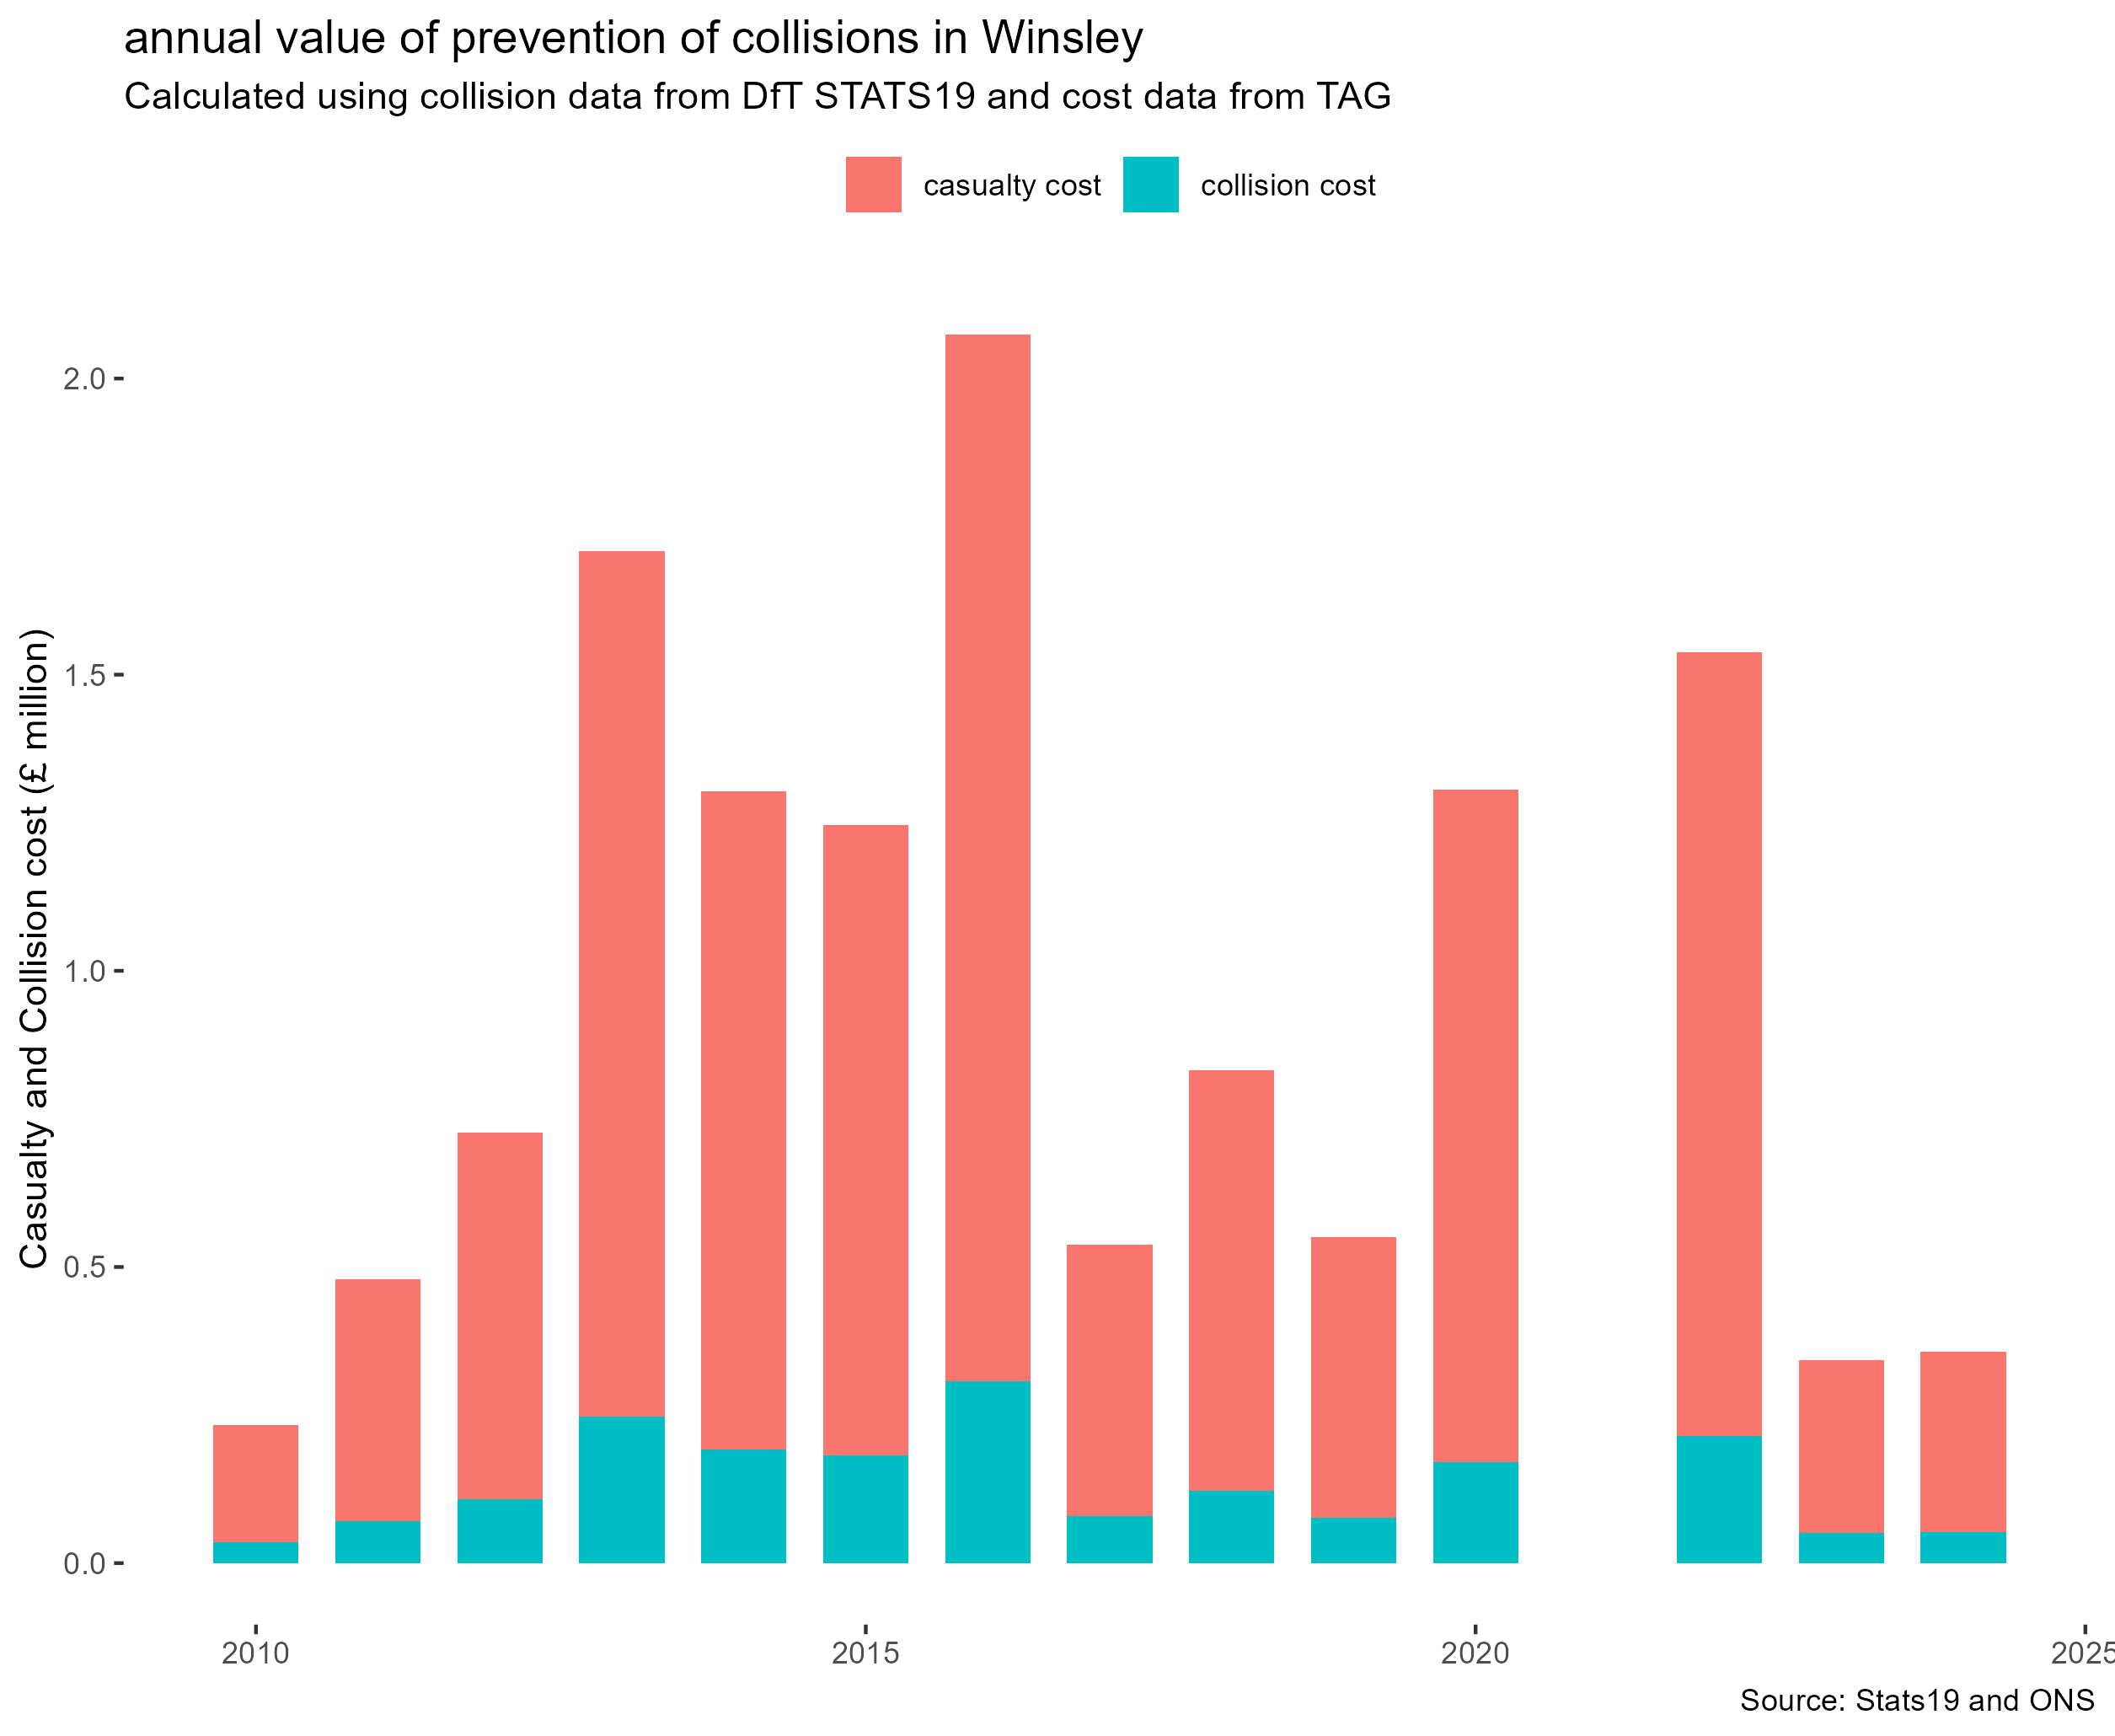 The total value of prevention for the period comes to £13,233,889, an average of just over £945,000 per year.
Cost per road link
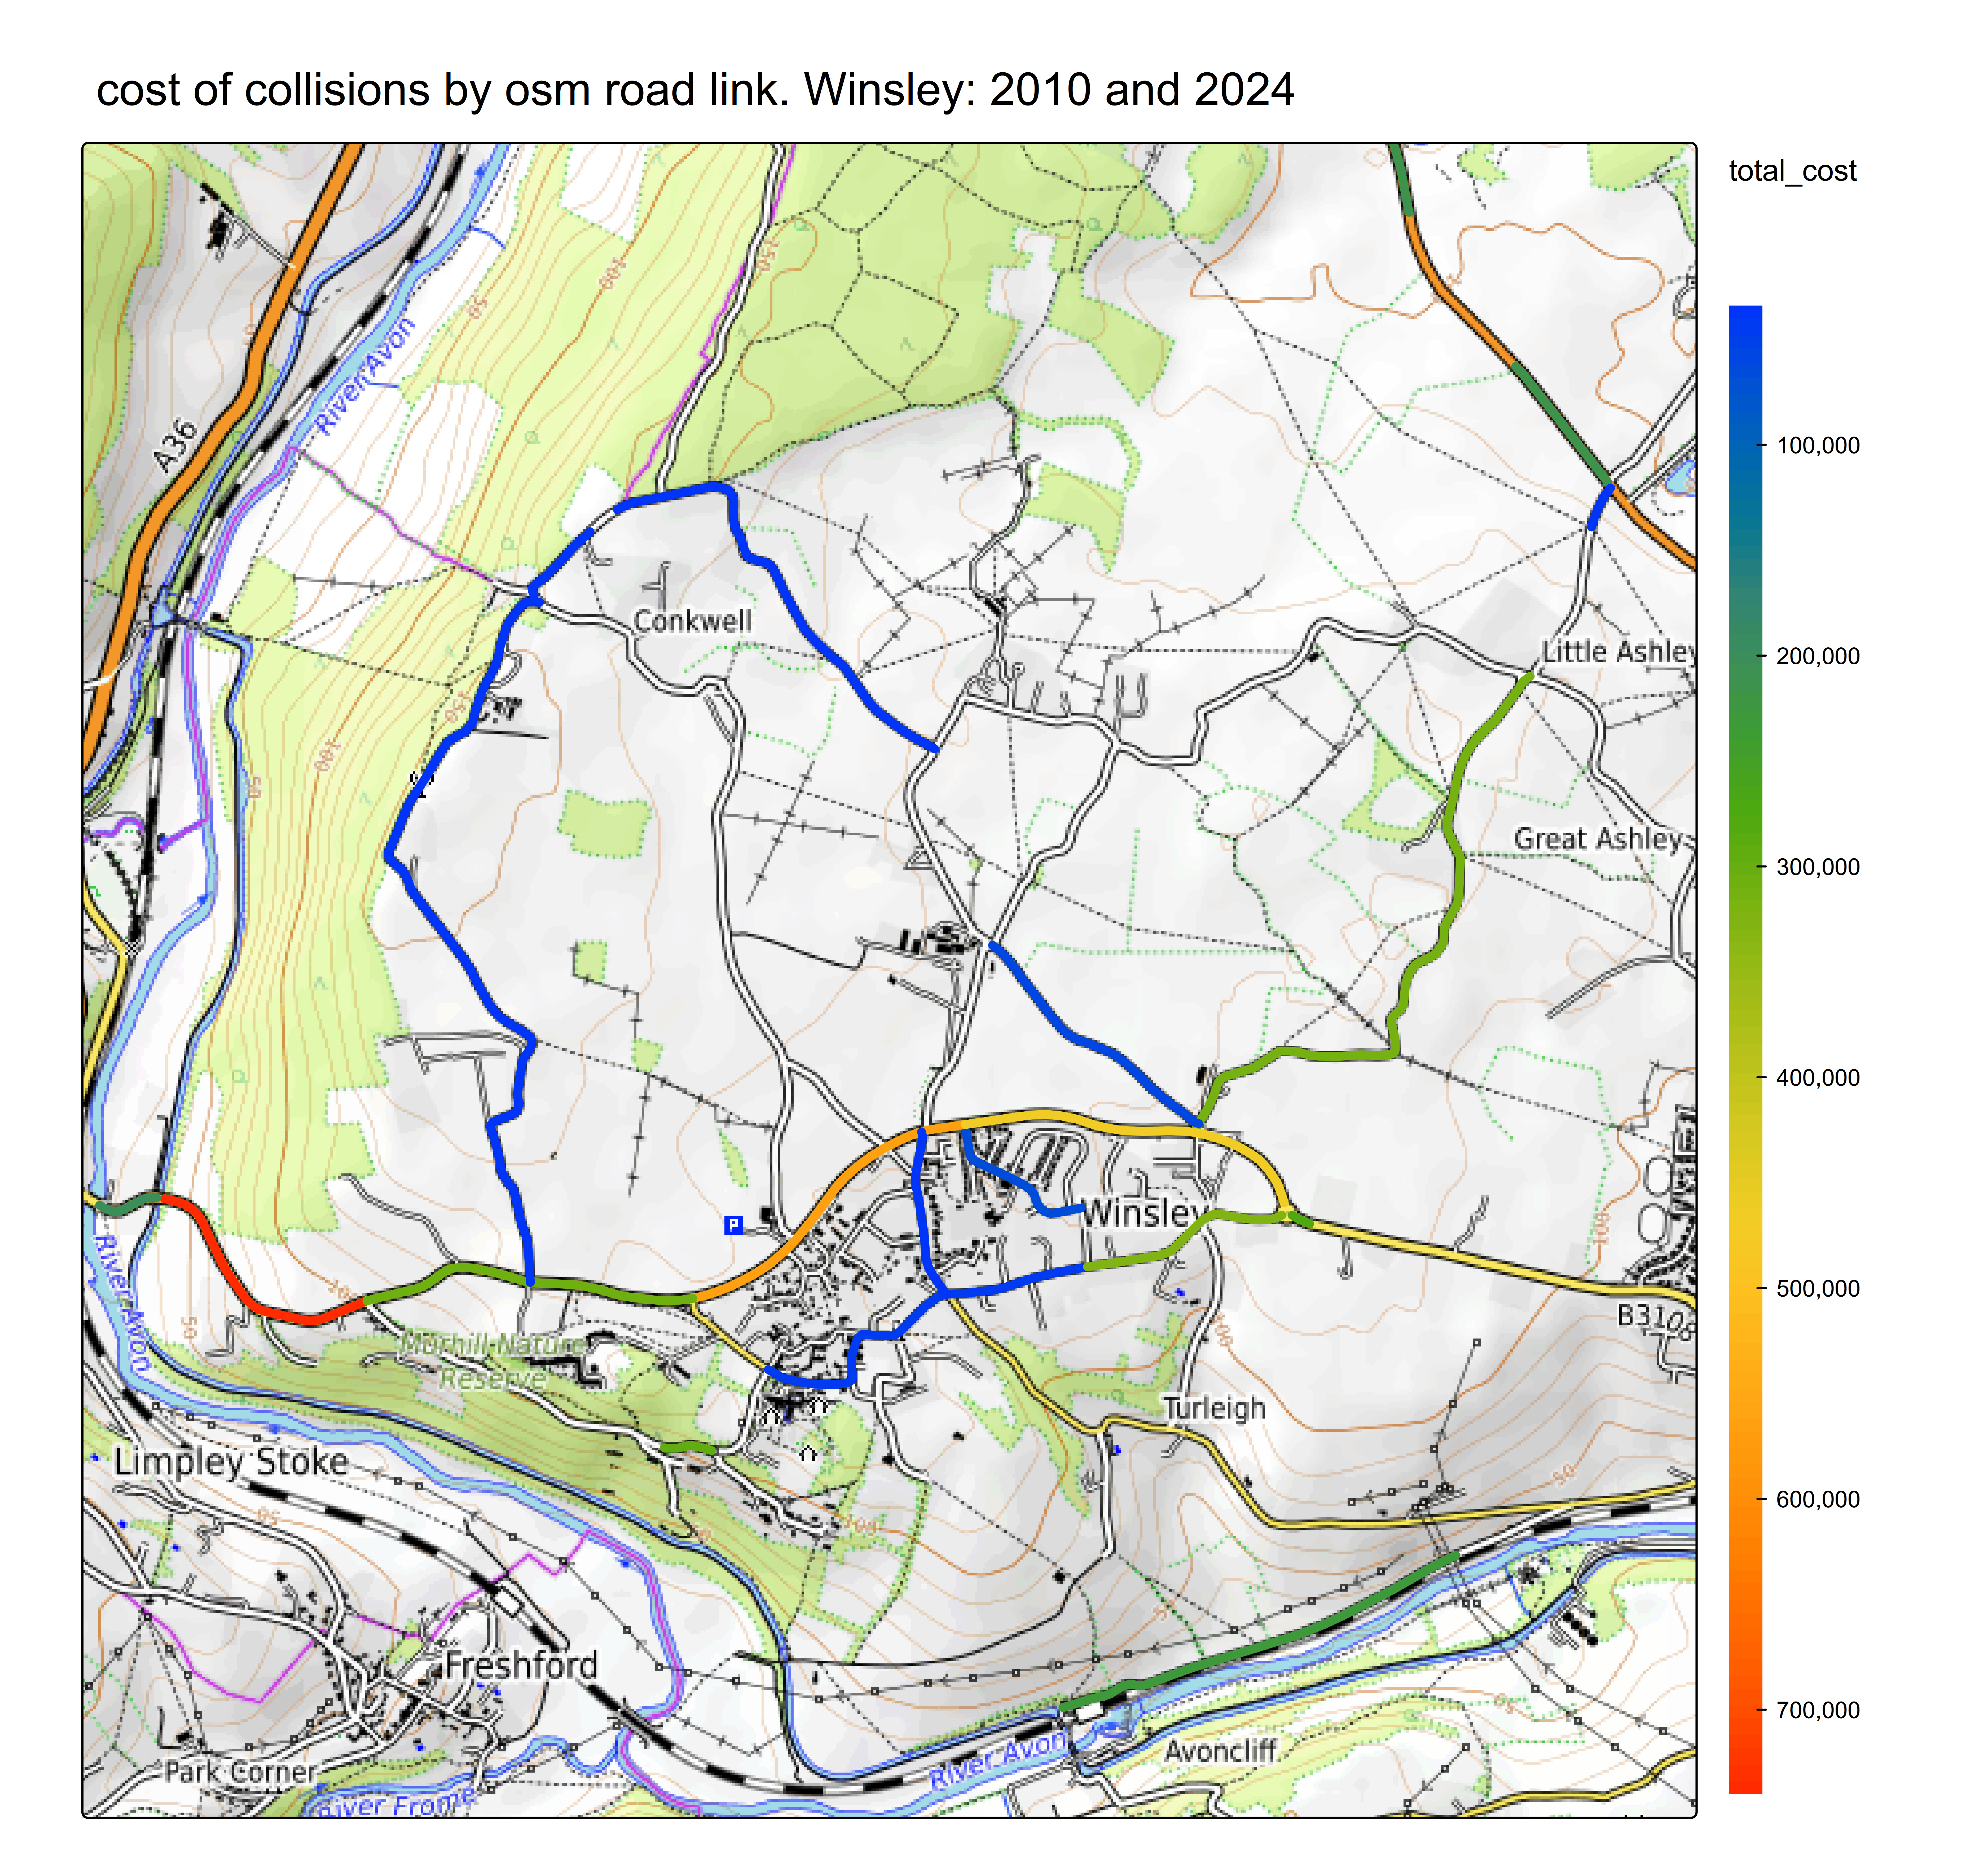
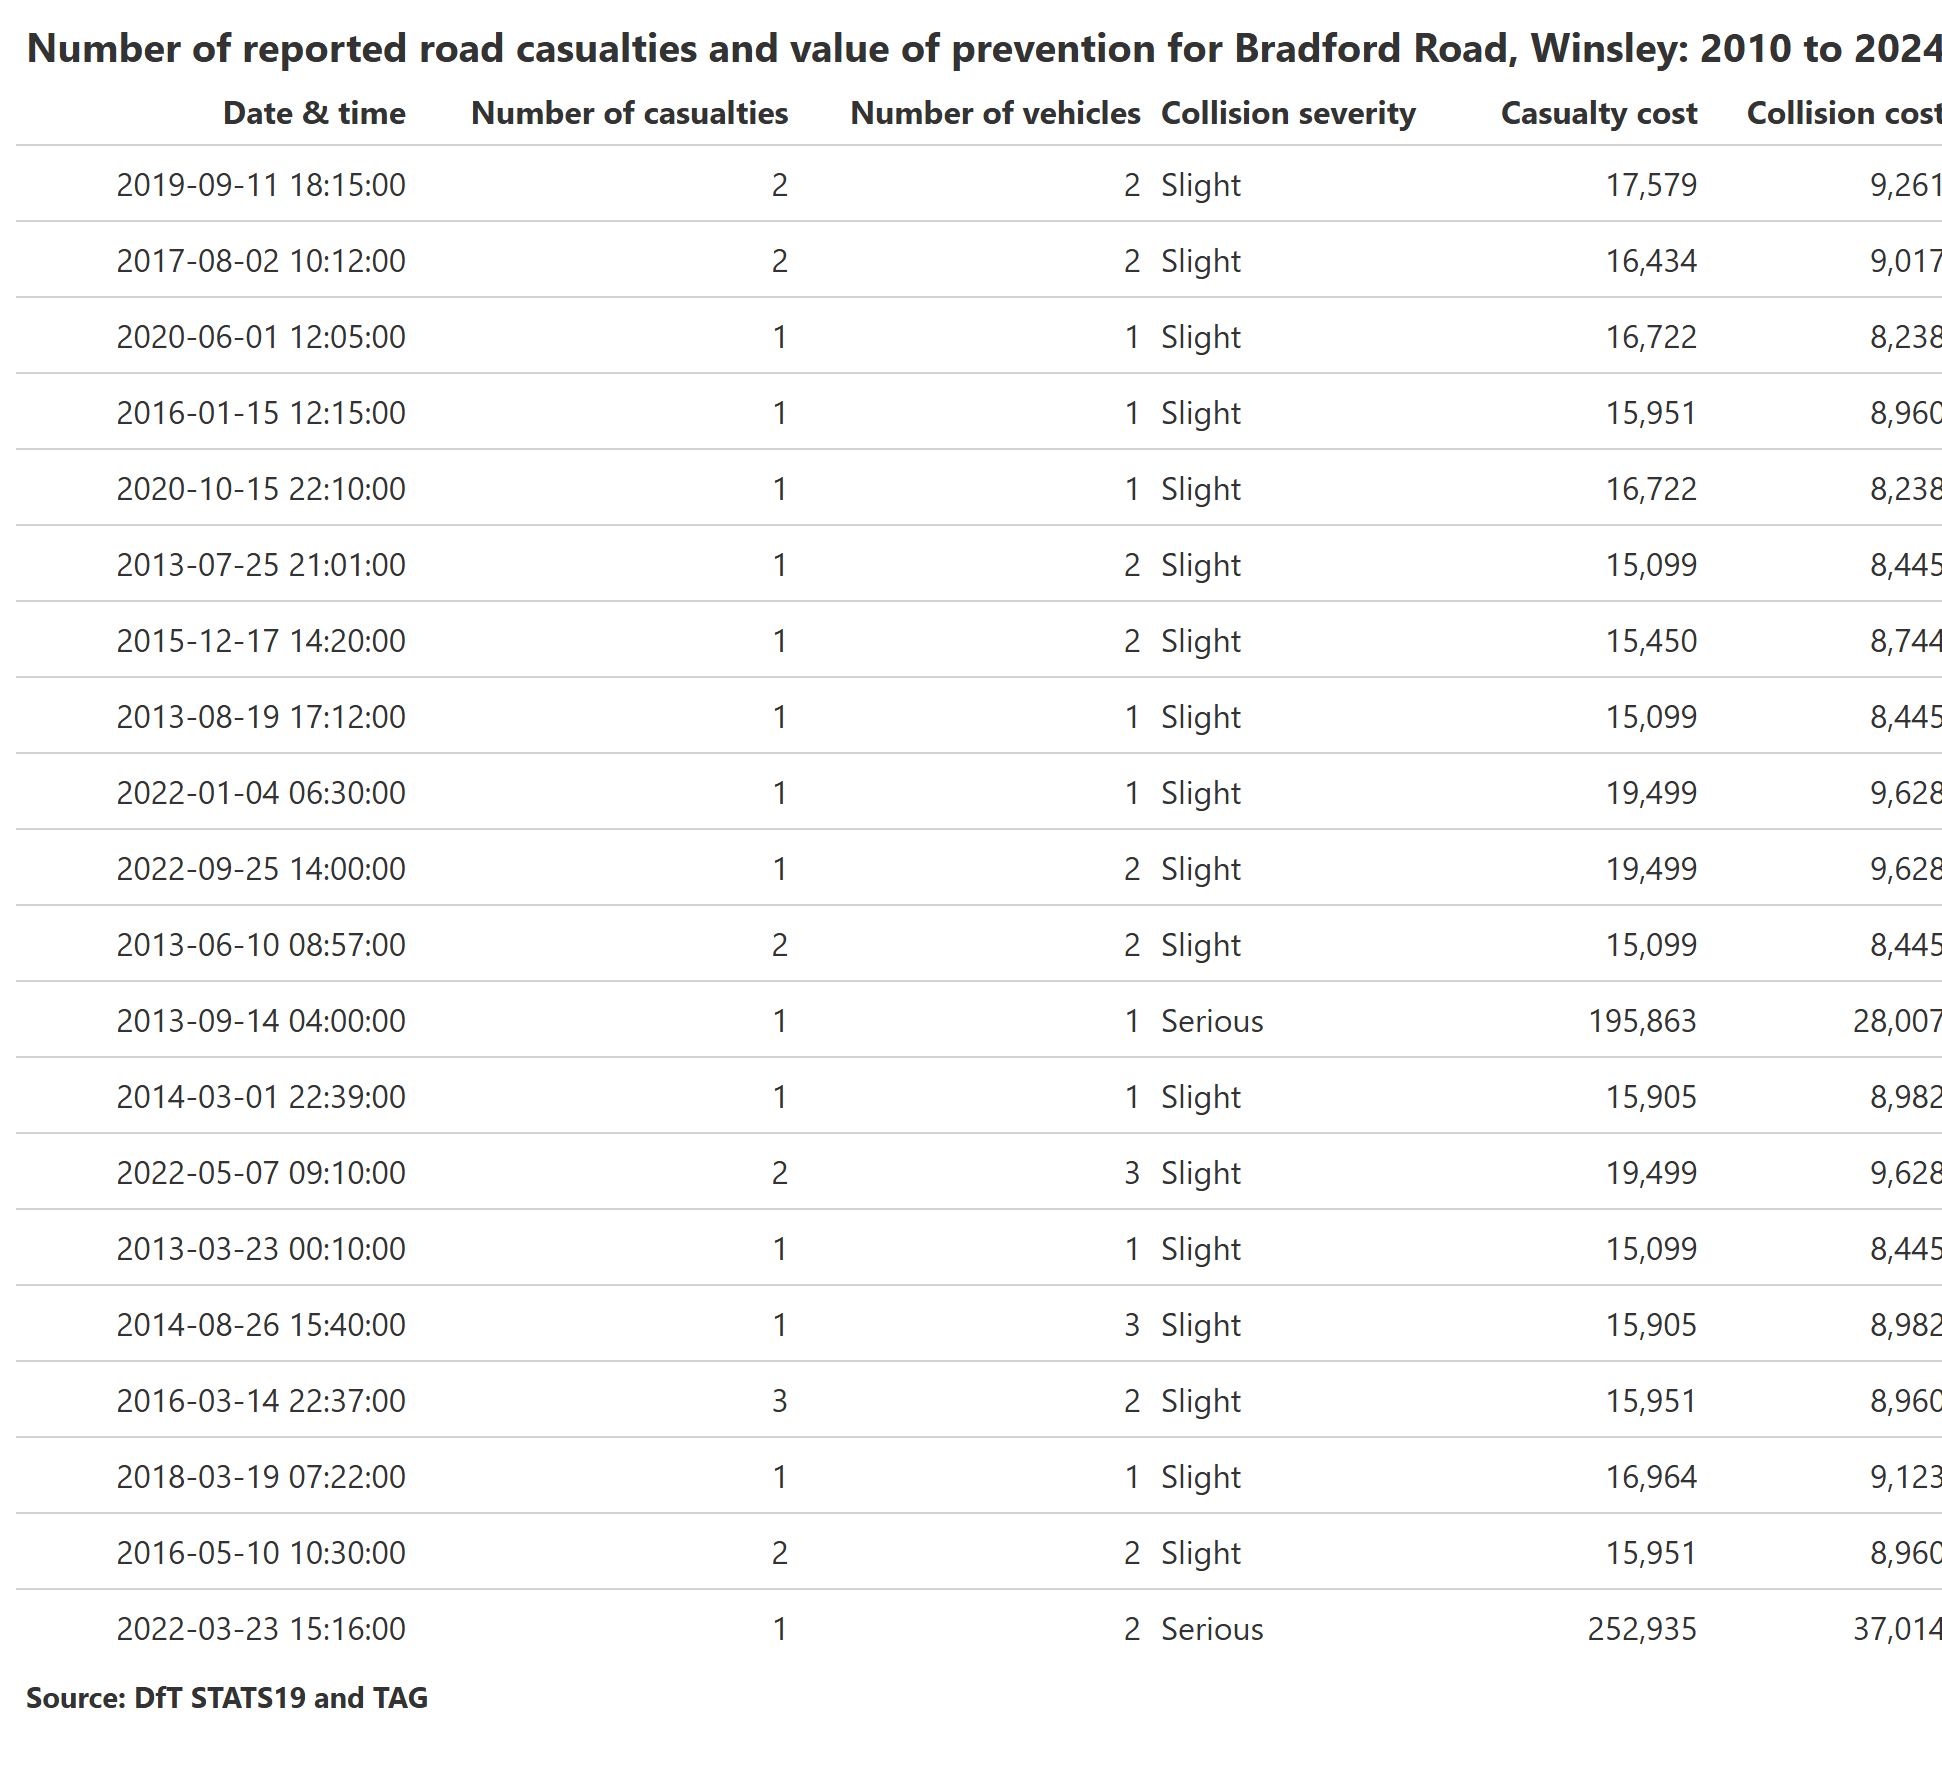
Bradford Road
For Bradford Road alone the cost of the 3 collisions (2 of which were multi-vehicle collisions) in this period comes to £371,938, broken down in the table below. 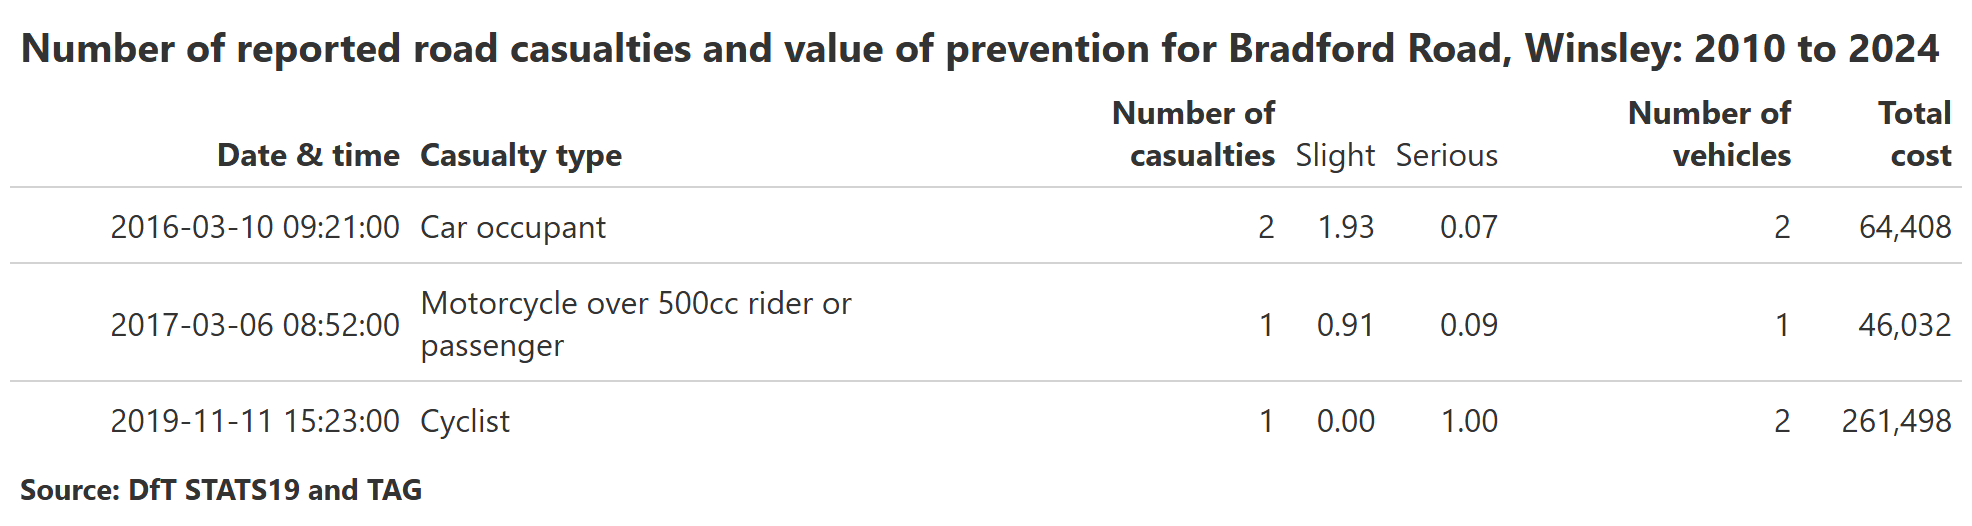
B3108 by-pass
A significant point of discussion in the local area is the B3108.
The table below shows the collisions for the section that runs through the village. The total cost of prevention for these is estimated at £972,376 in the period 2010 - 2024.
The Lower Super Area Output (LSOA) regions where casualties from collisions on the road live are shown in the plot below. 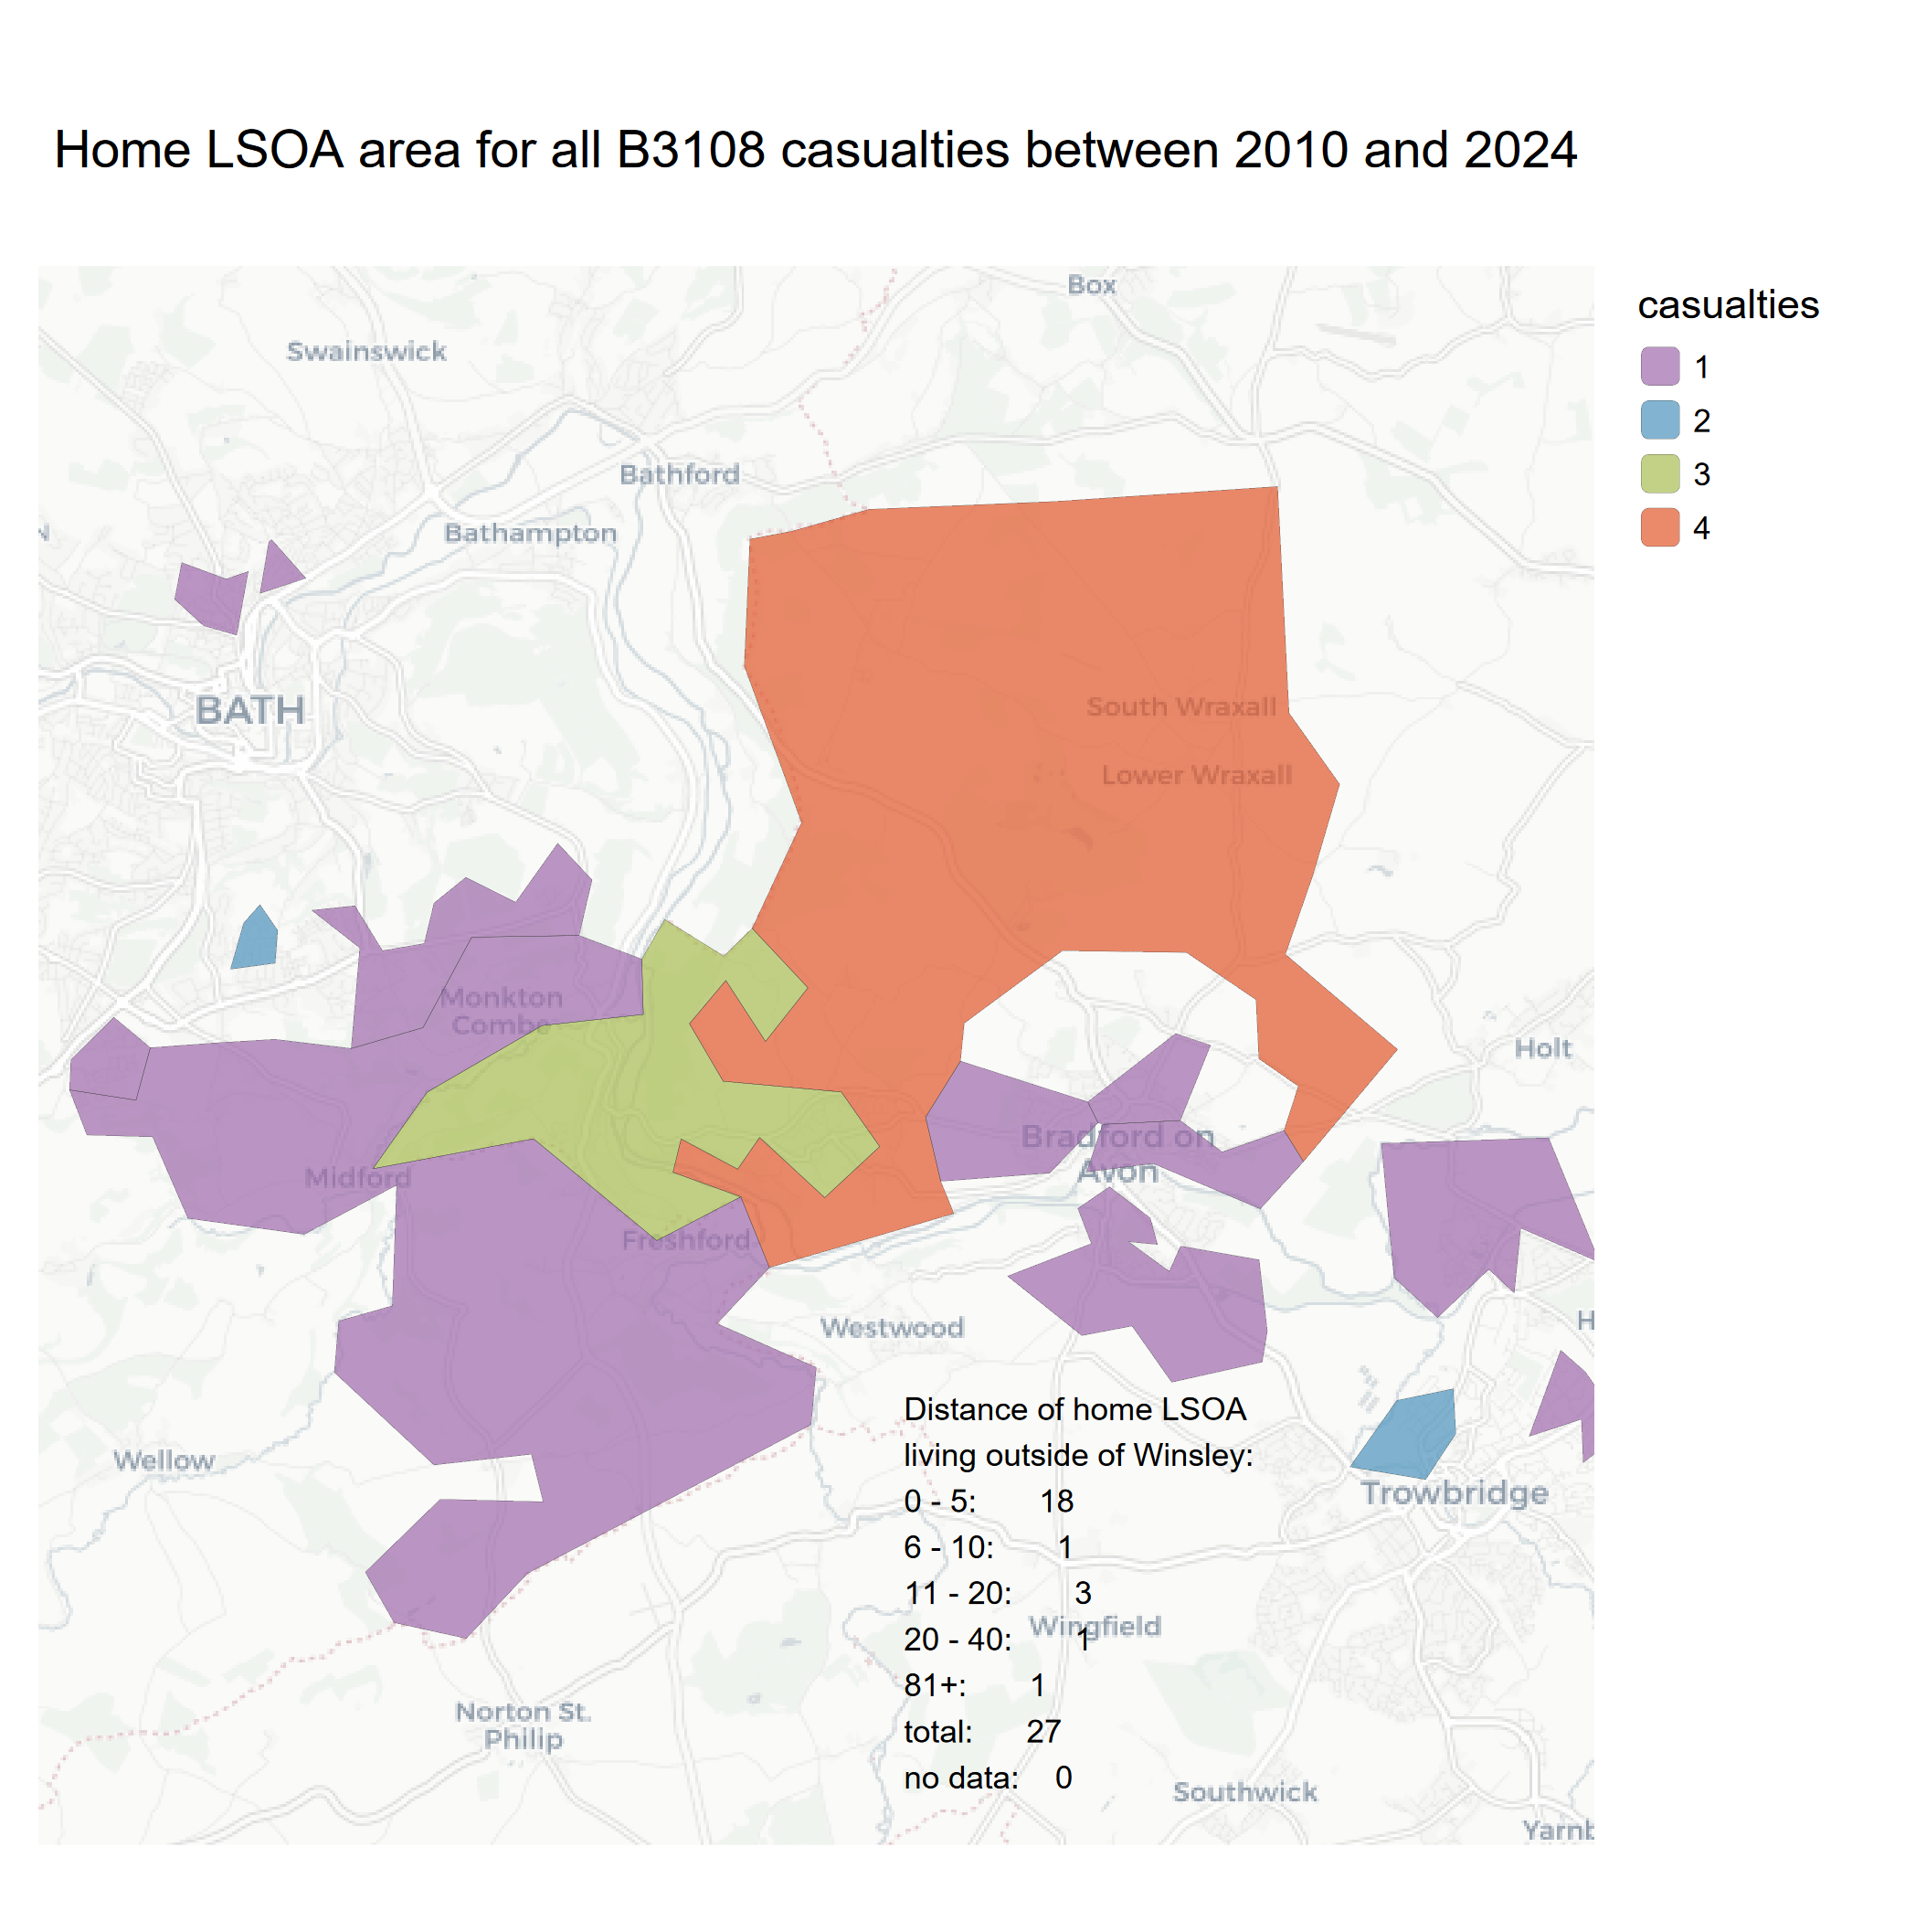 And the same plot but for drivers who were involved in collisions on the road (note this also includes cyclist ‘drivers’).
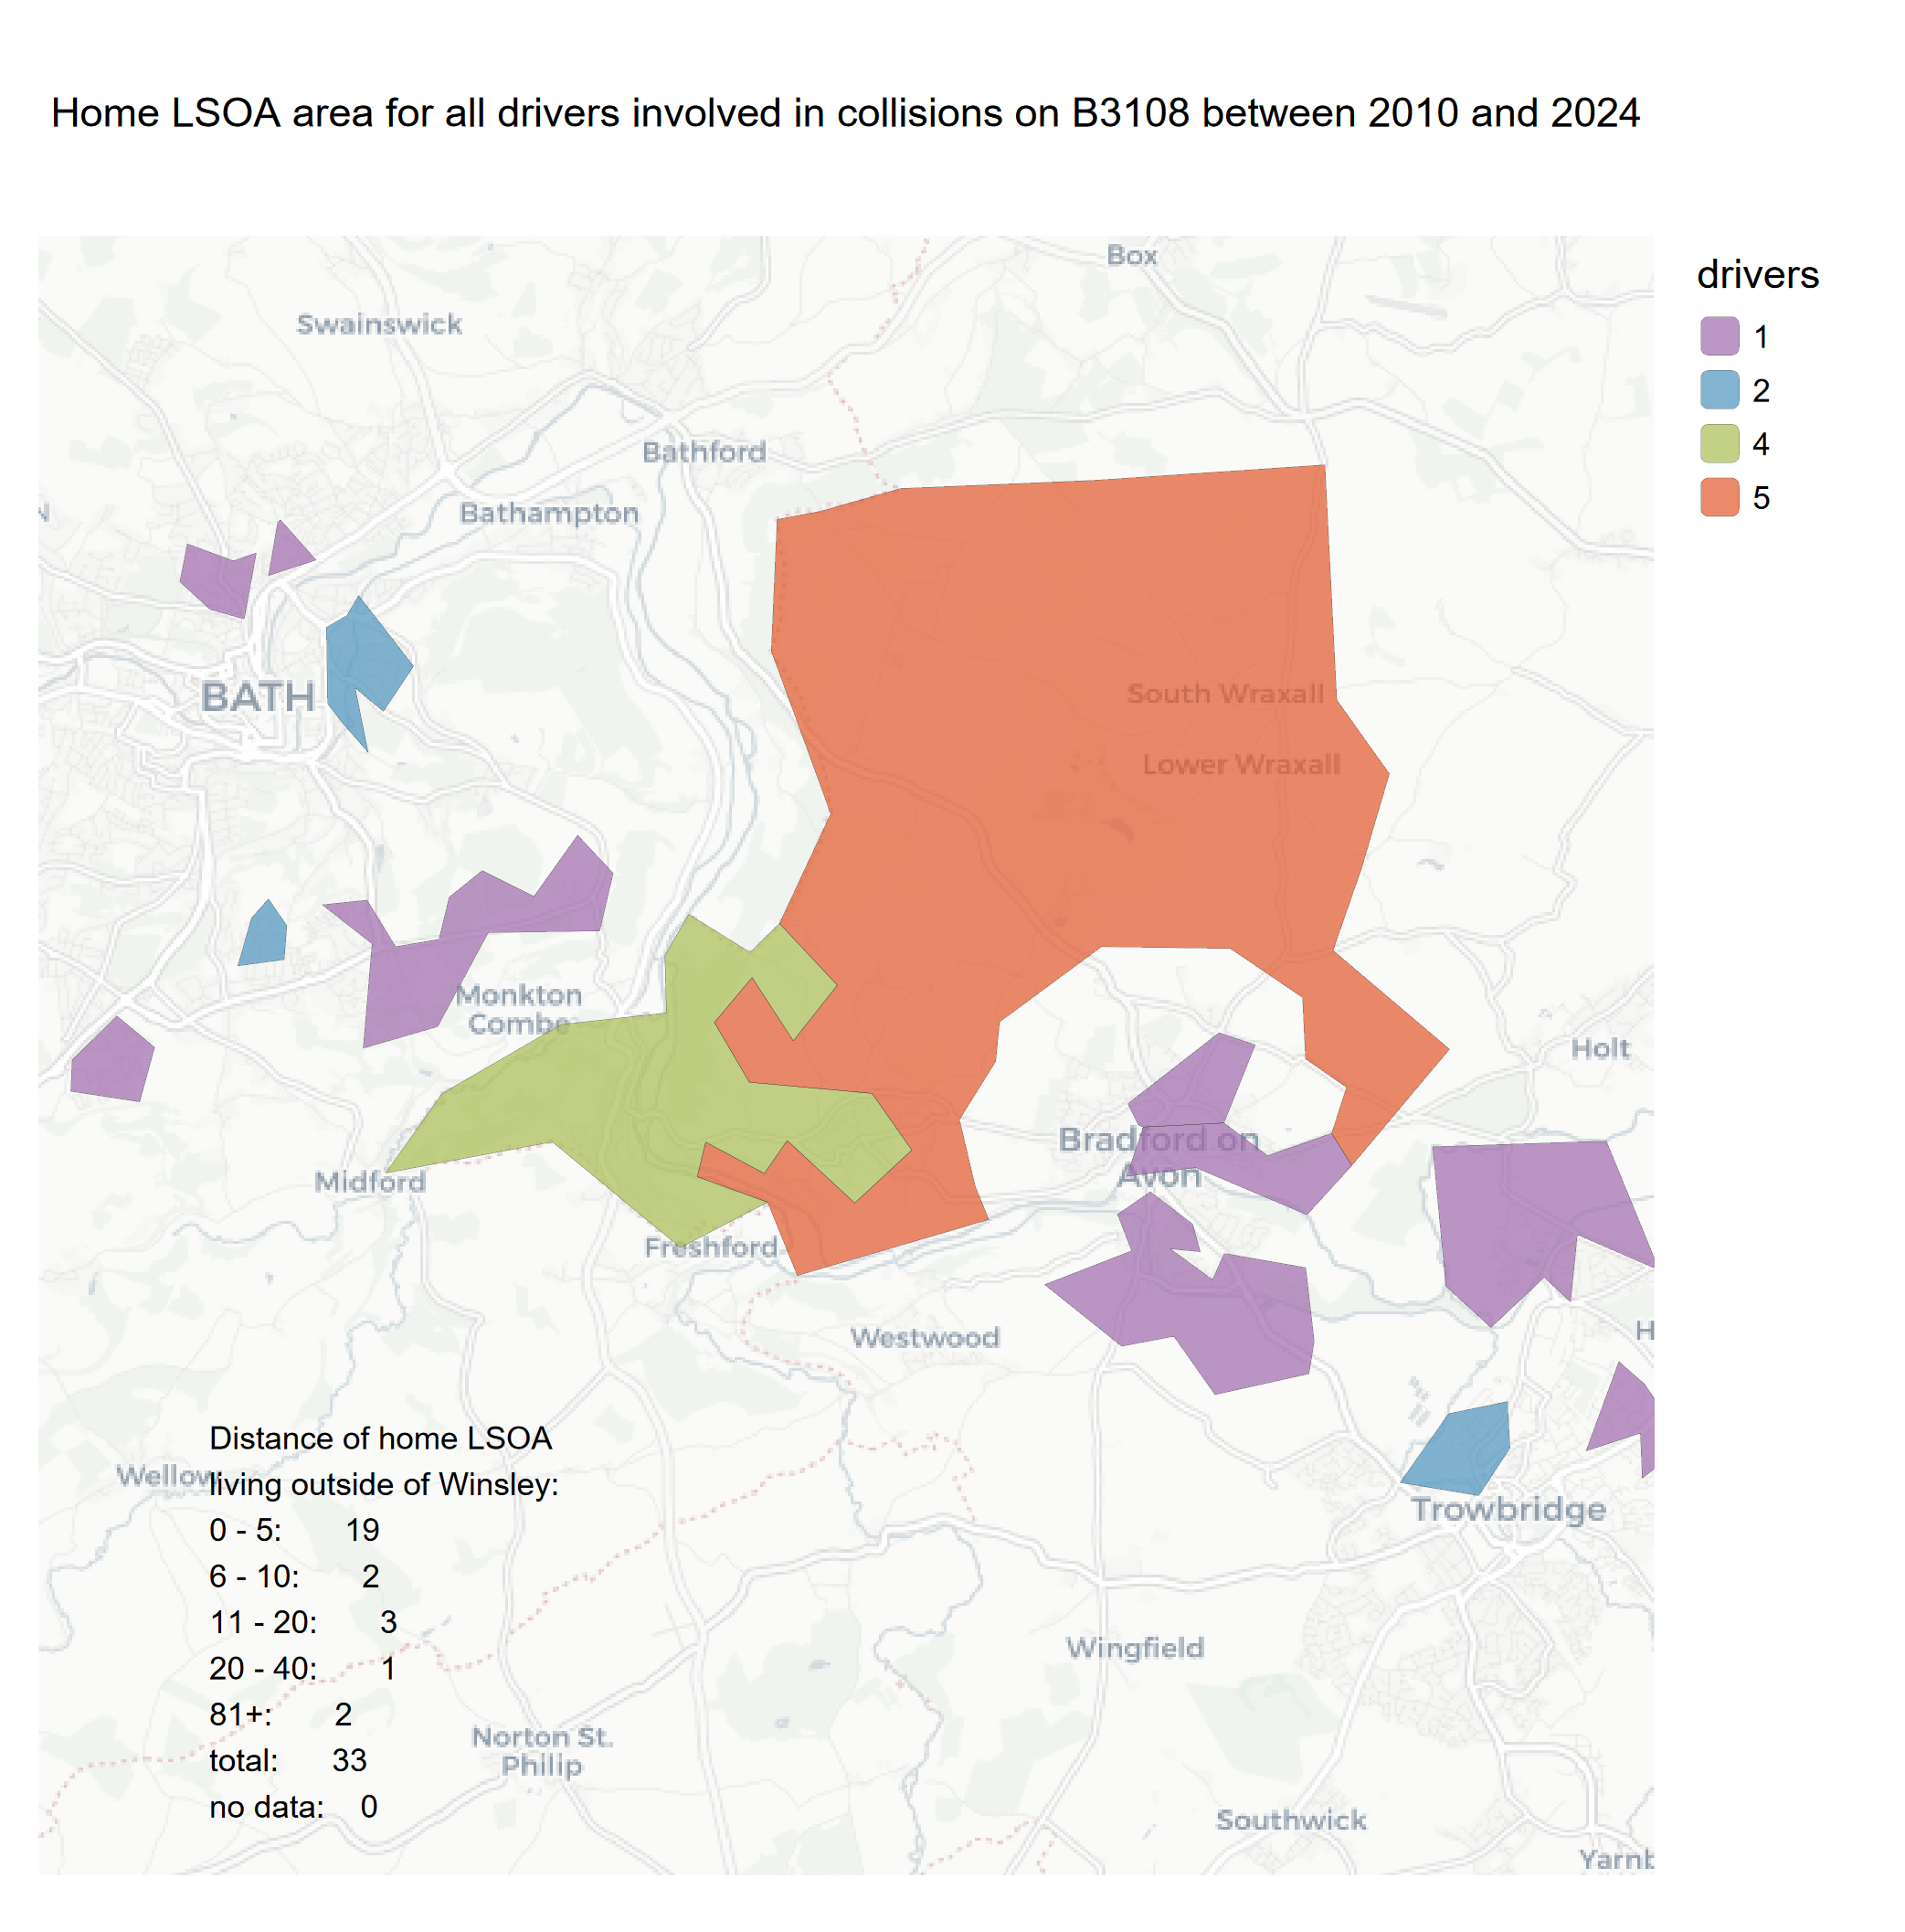
Extra data
Breaking down the total casualties in this period by some other variables
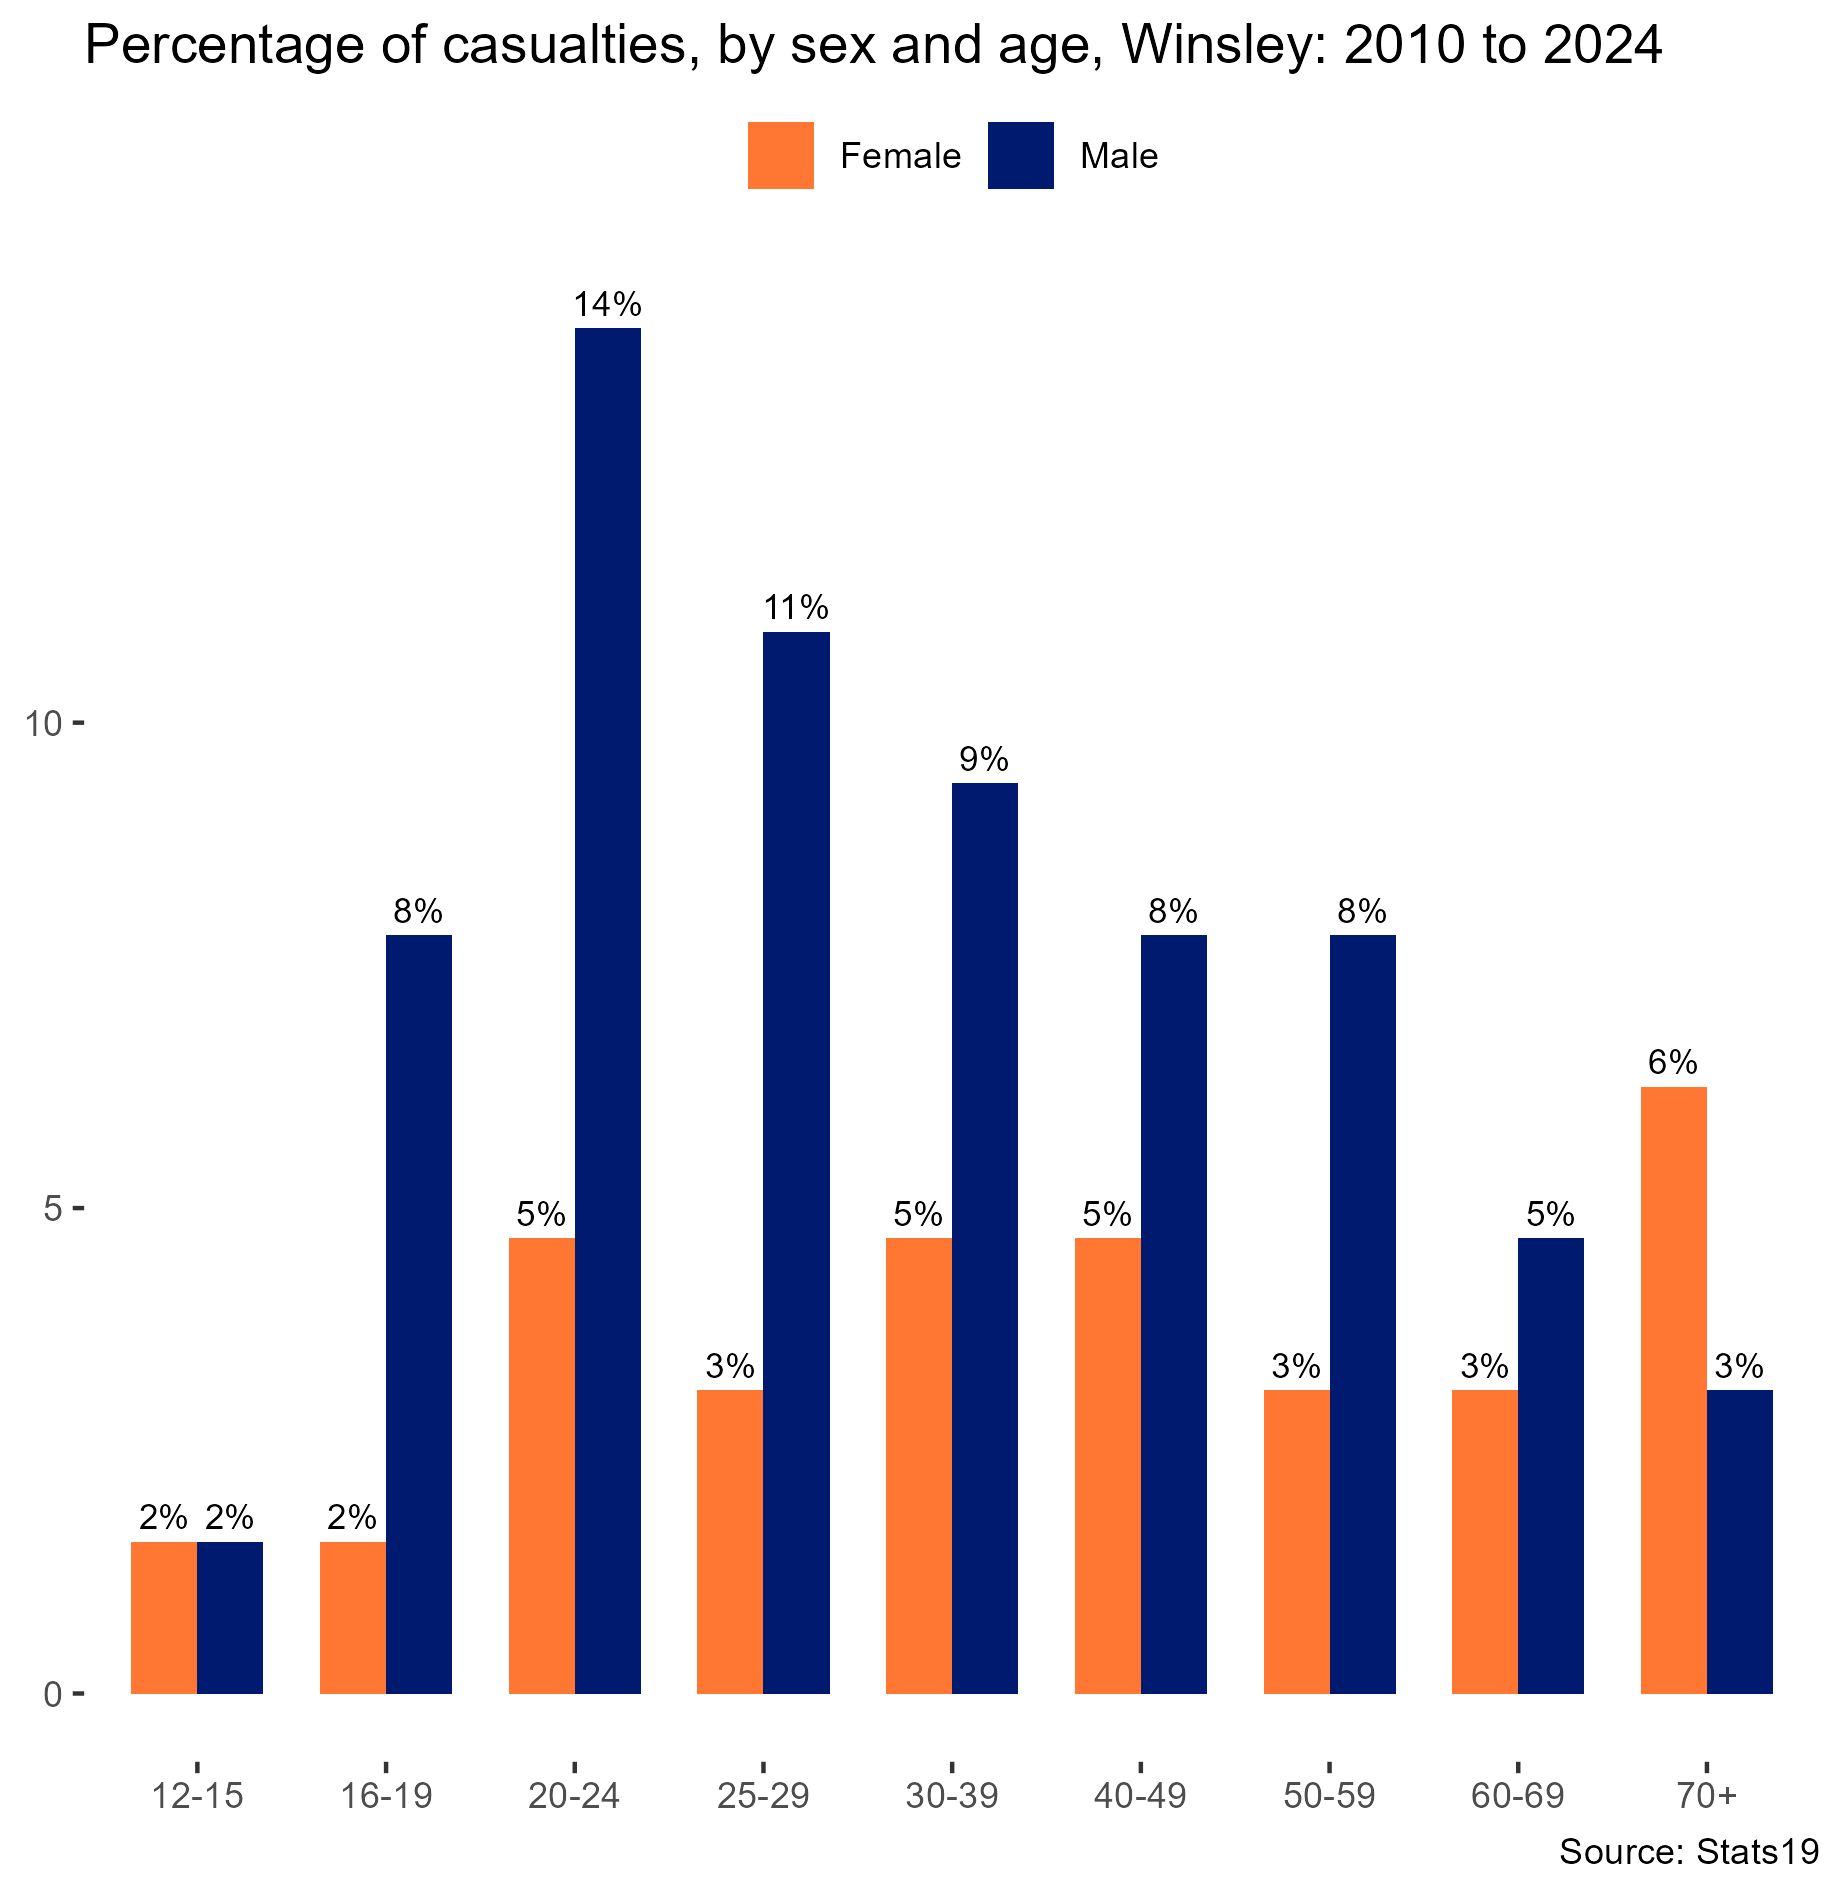
Age and sex
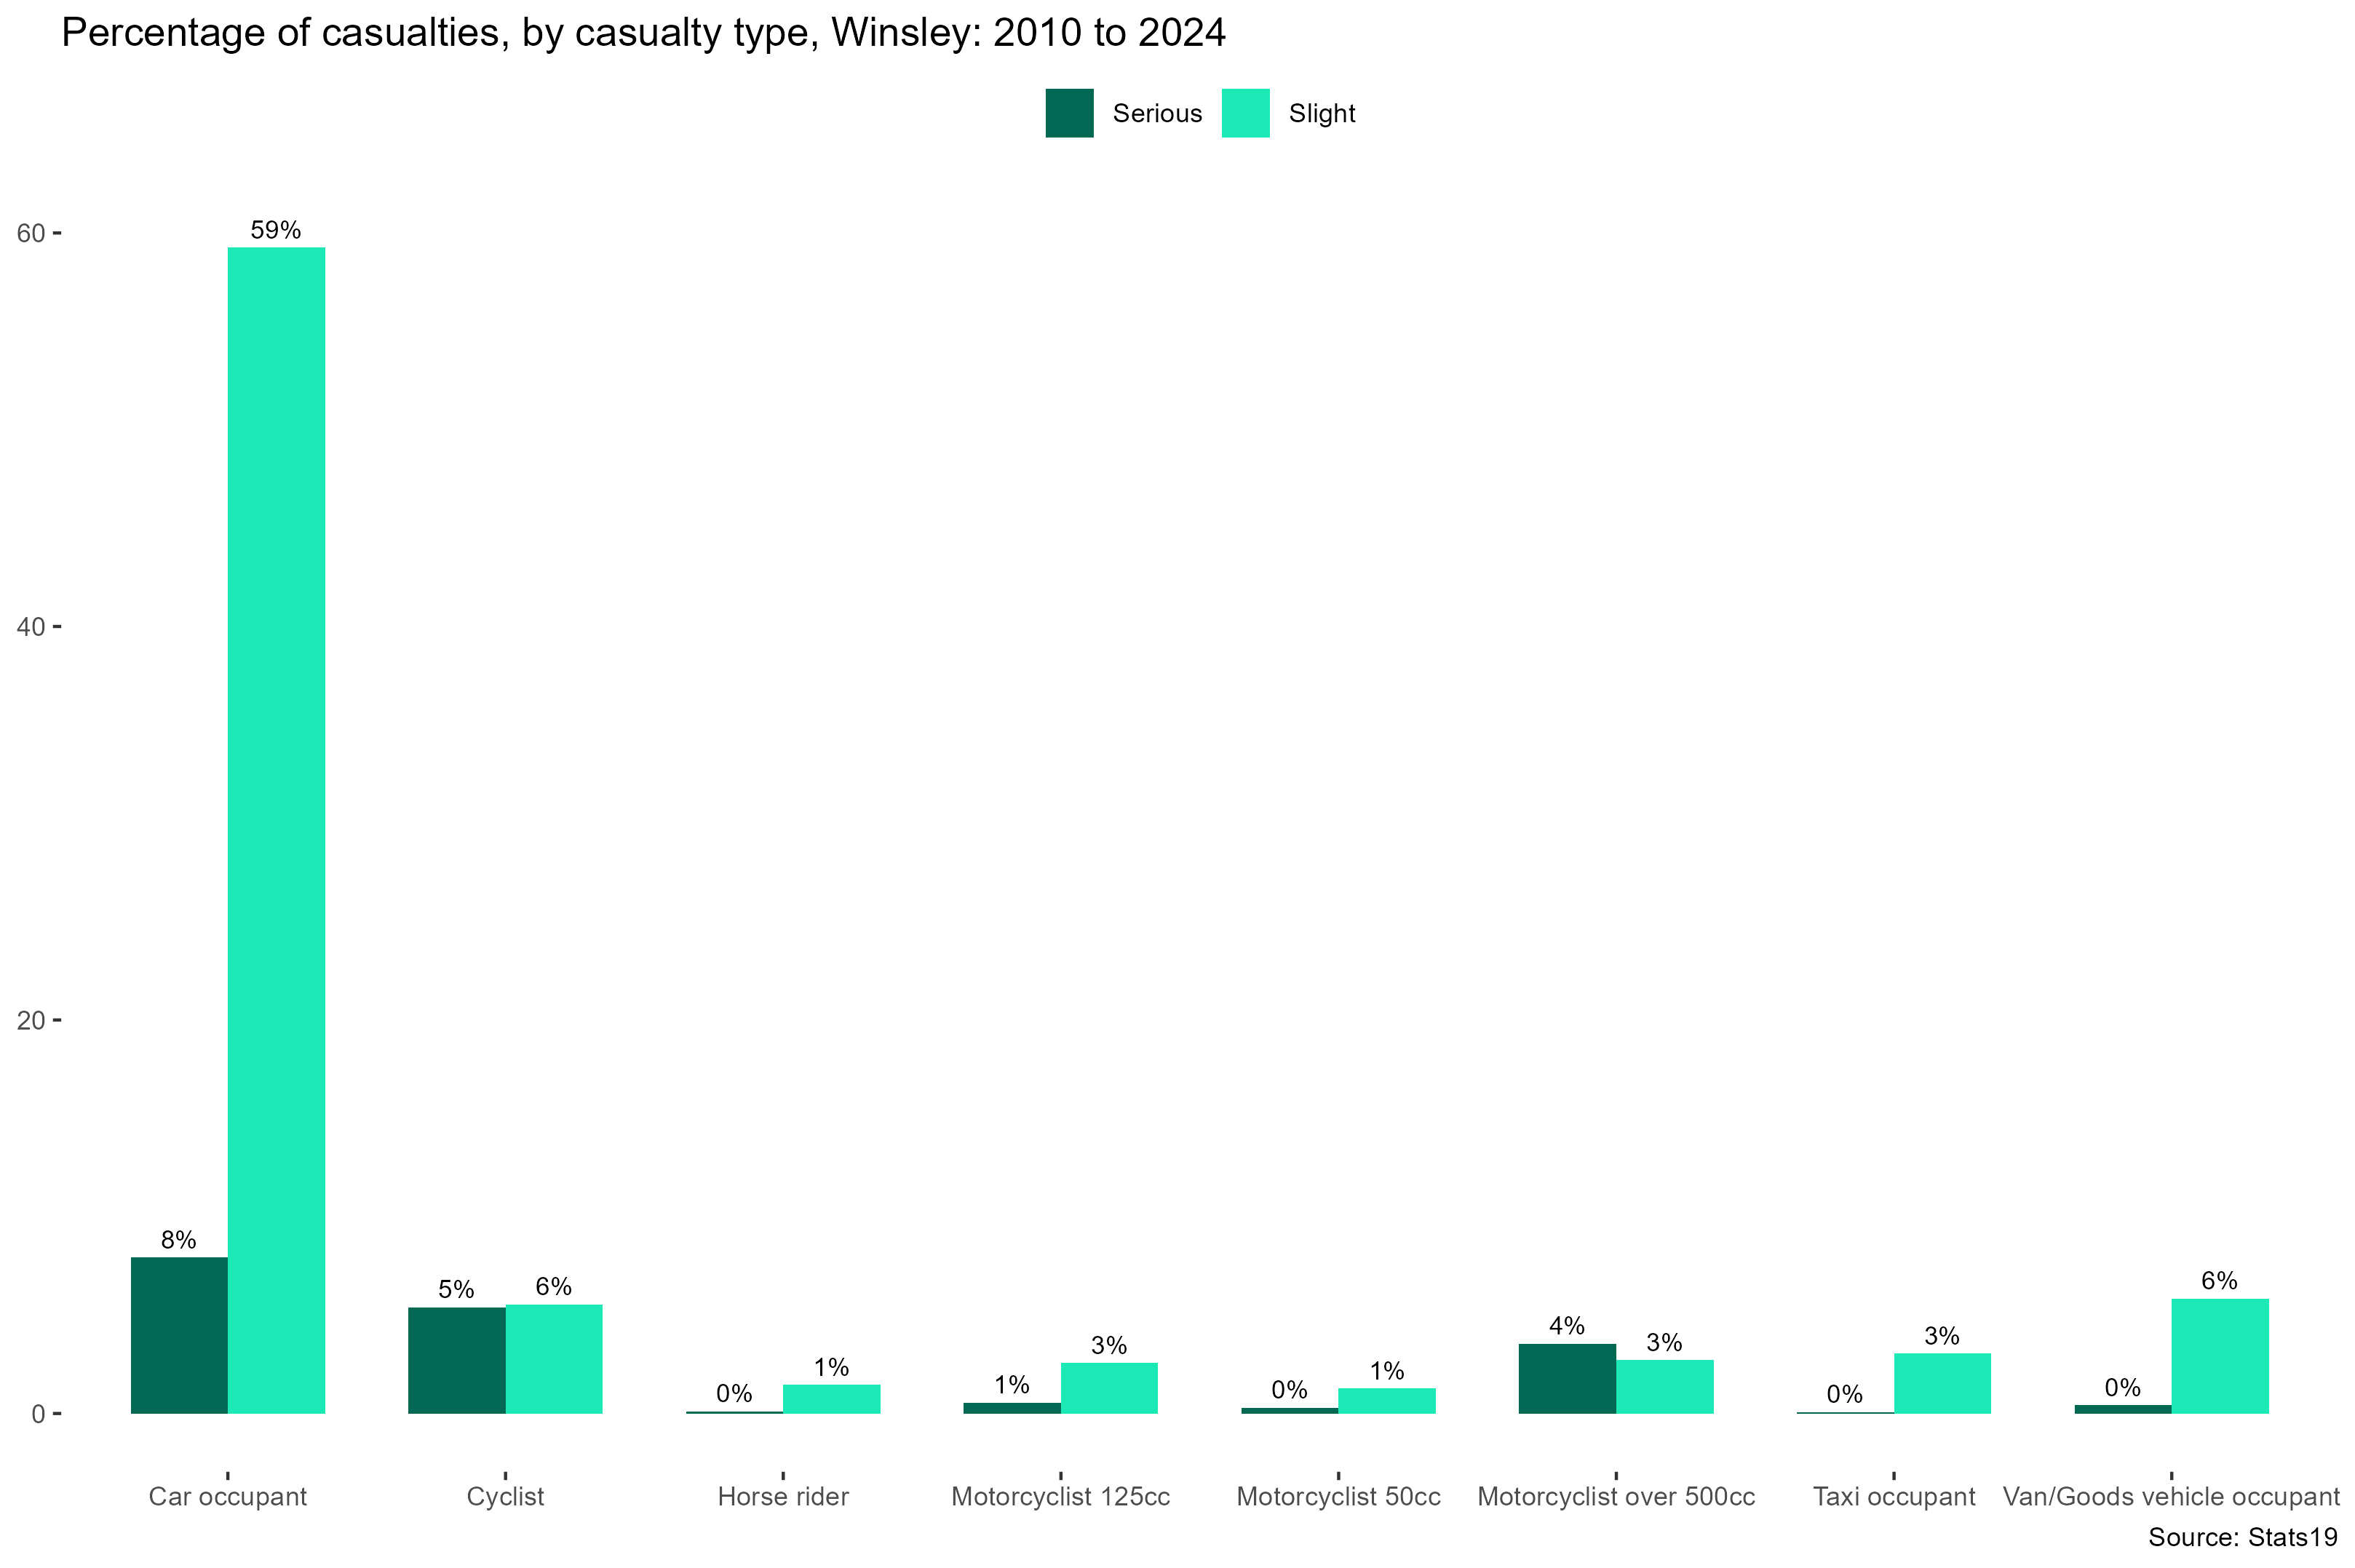
Casualty type
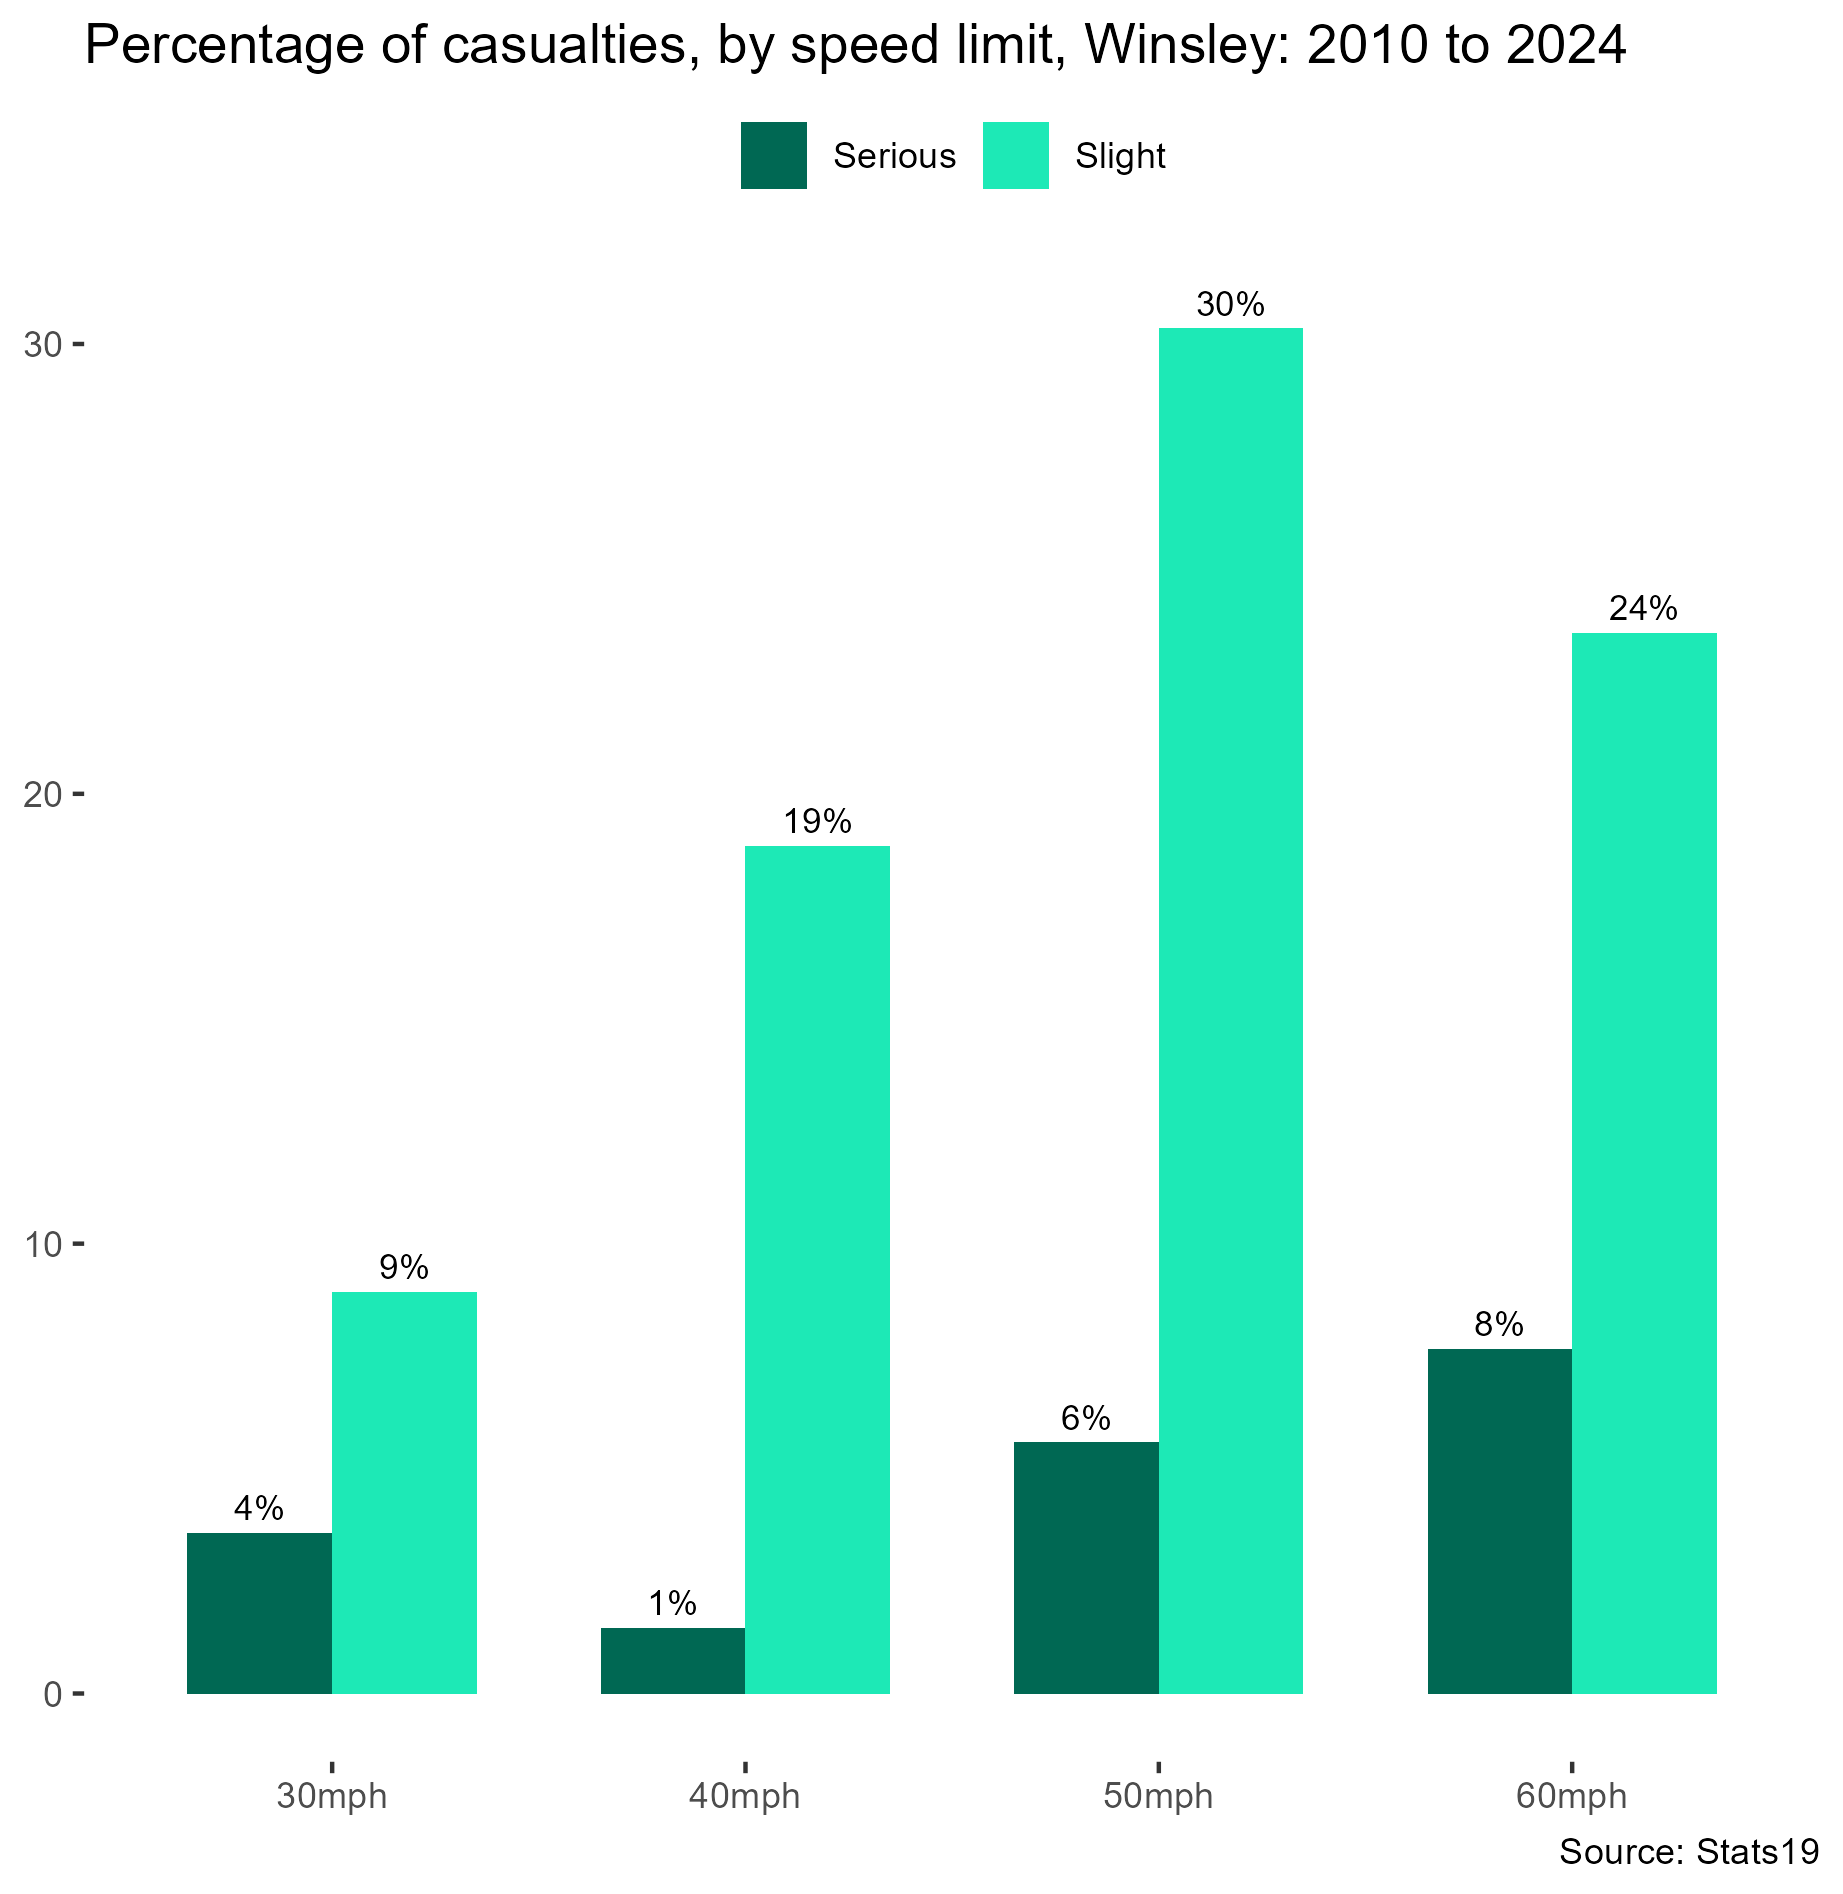
Speed limit
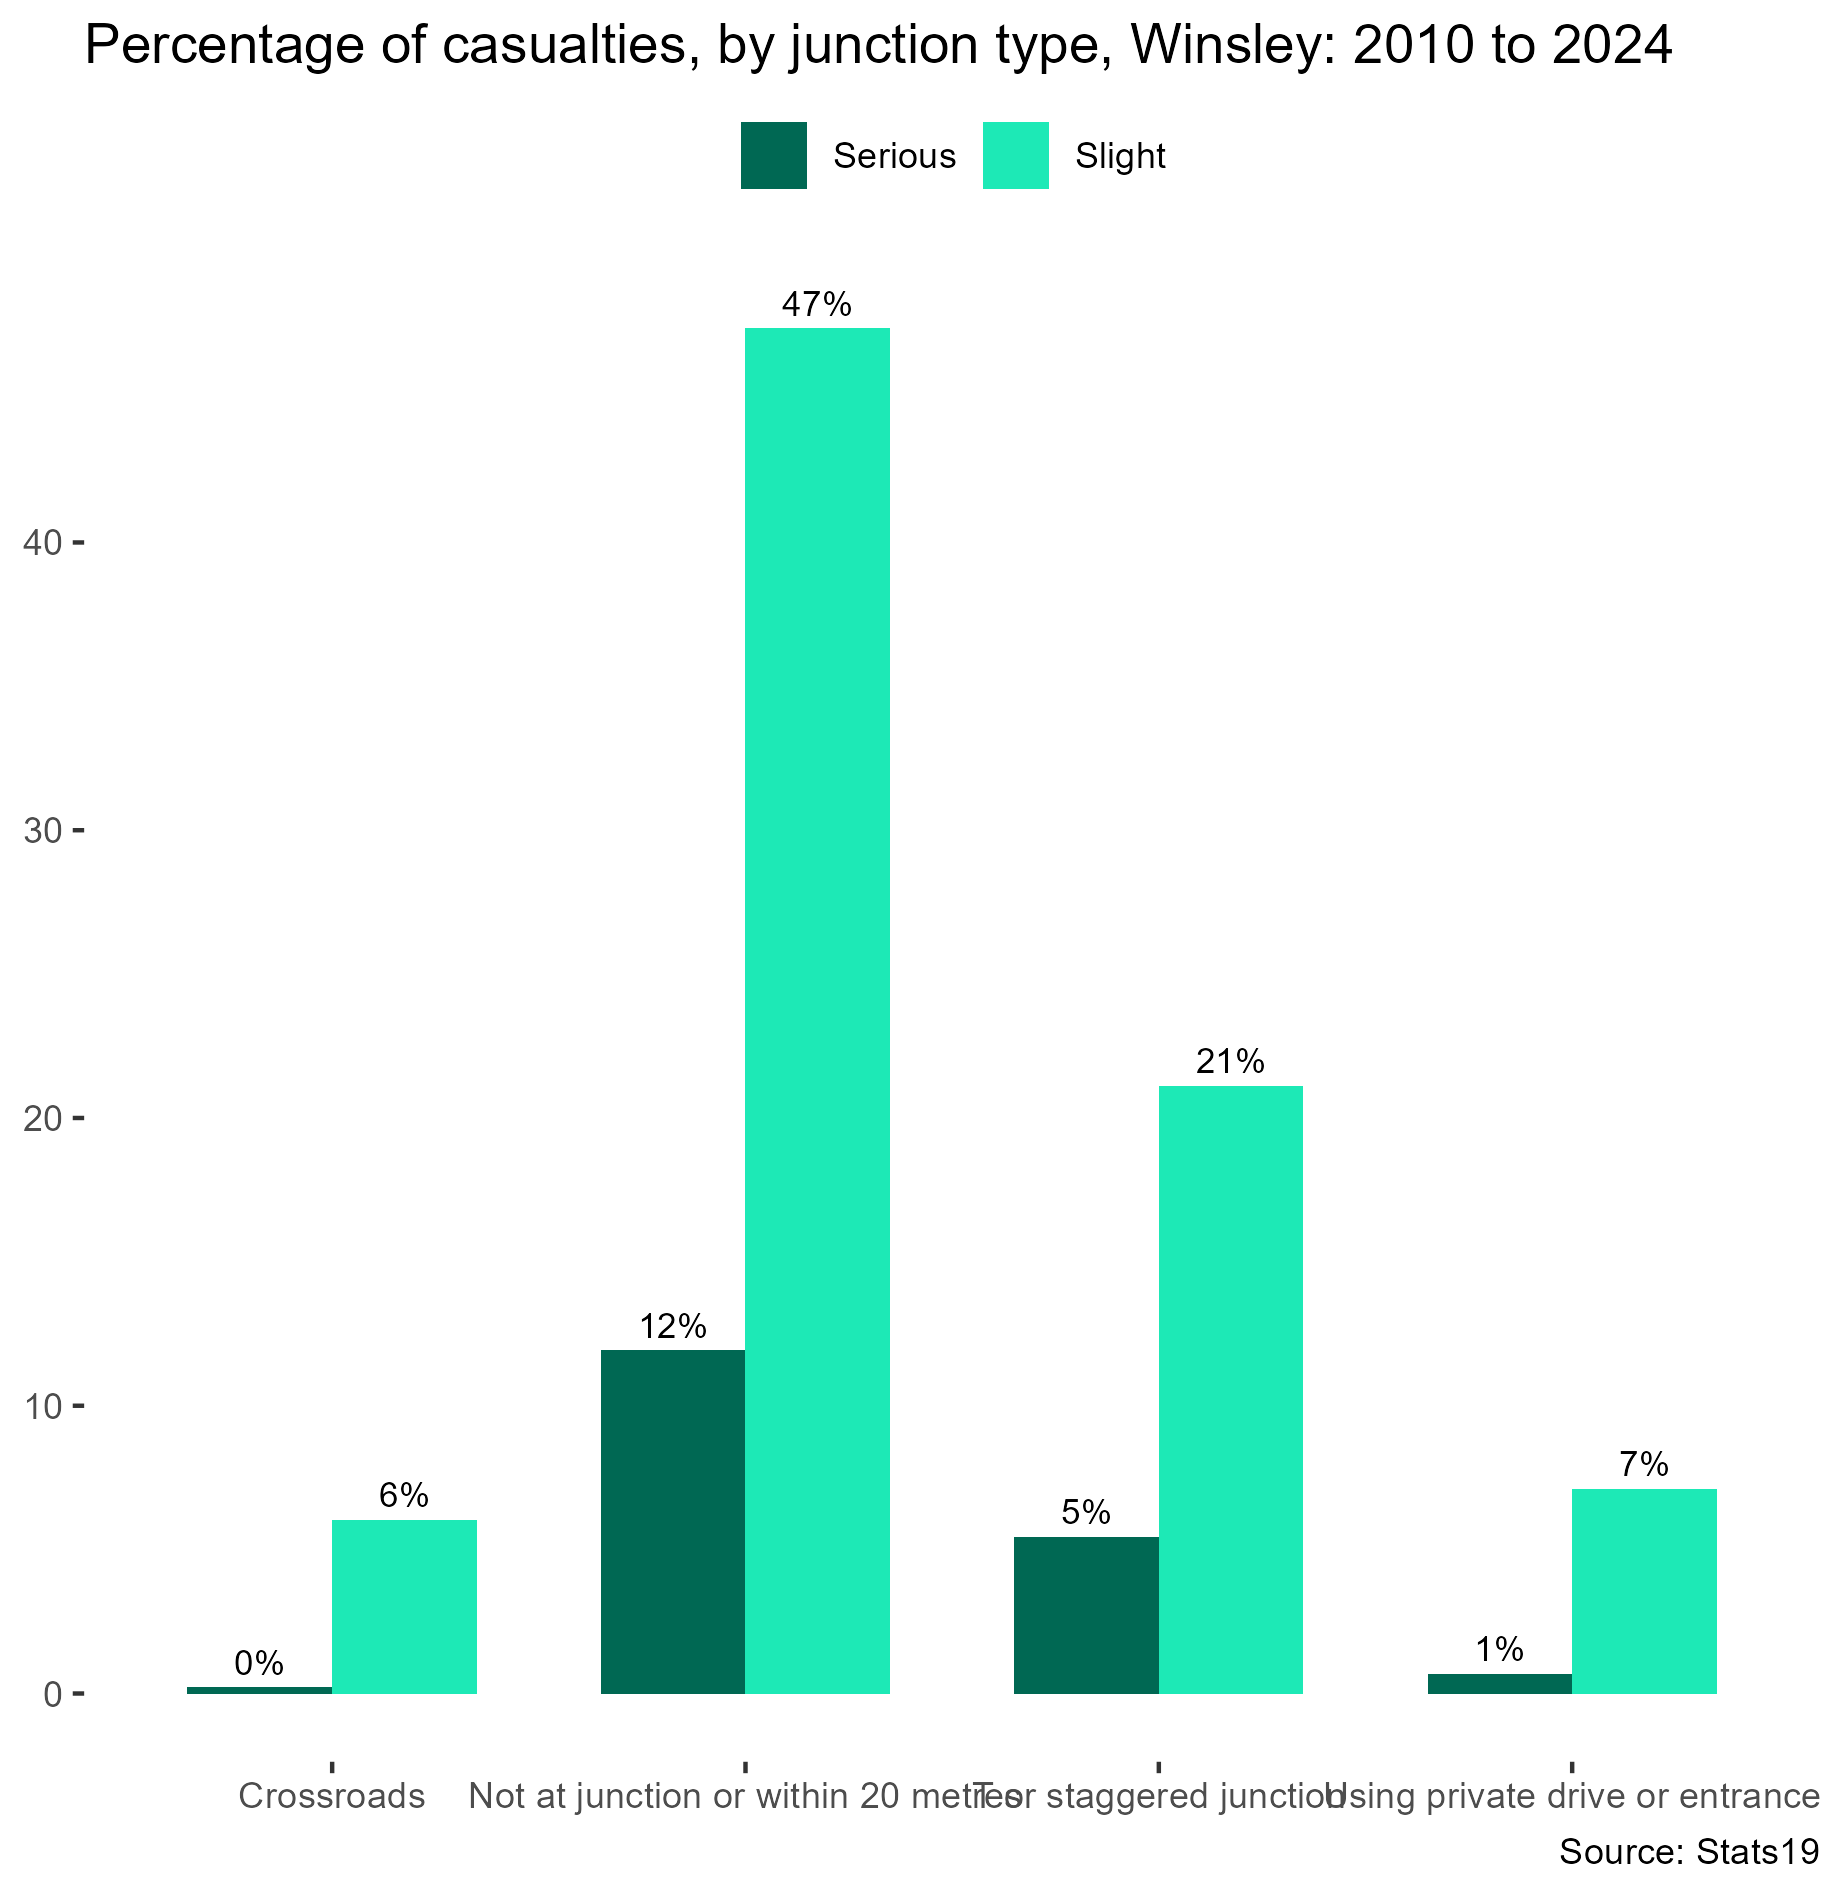
Junctions
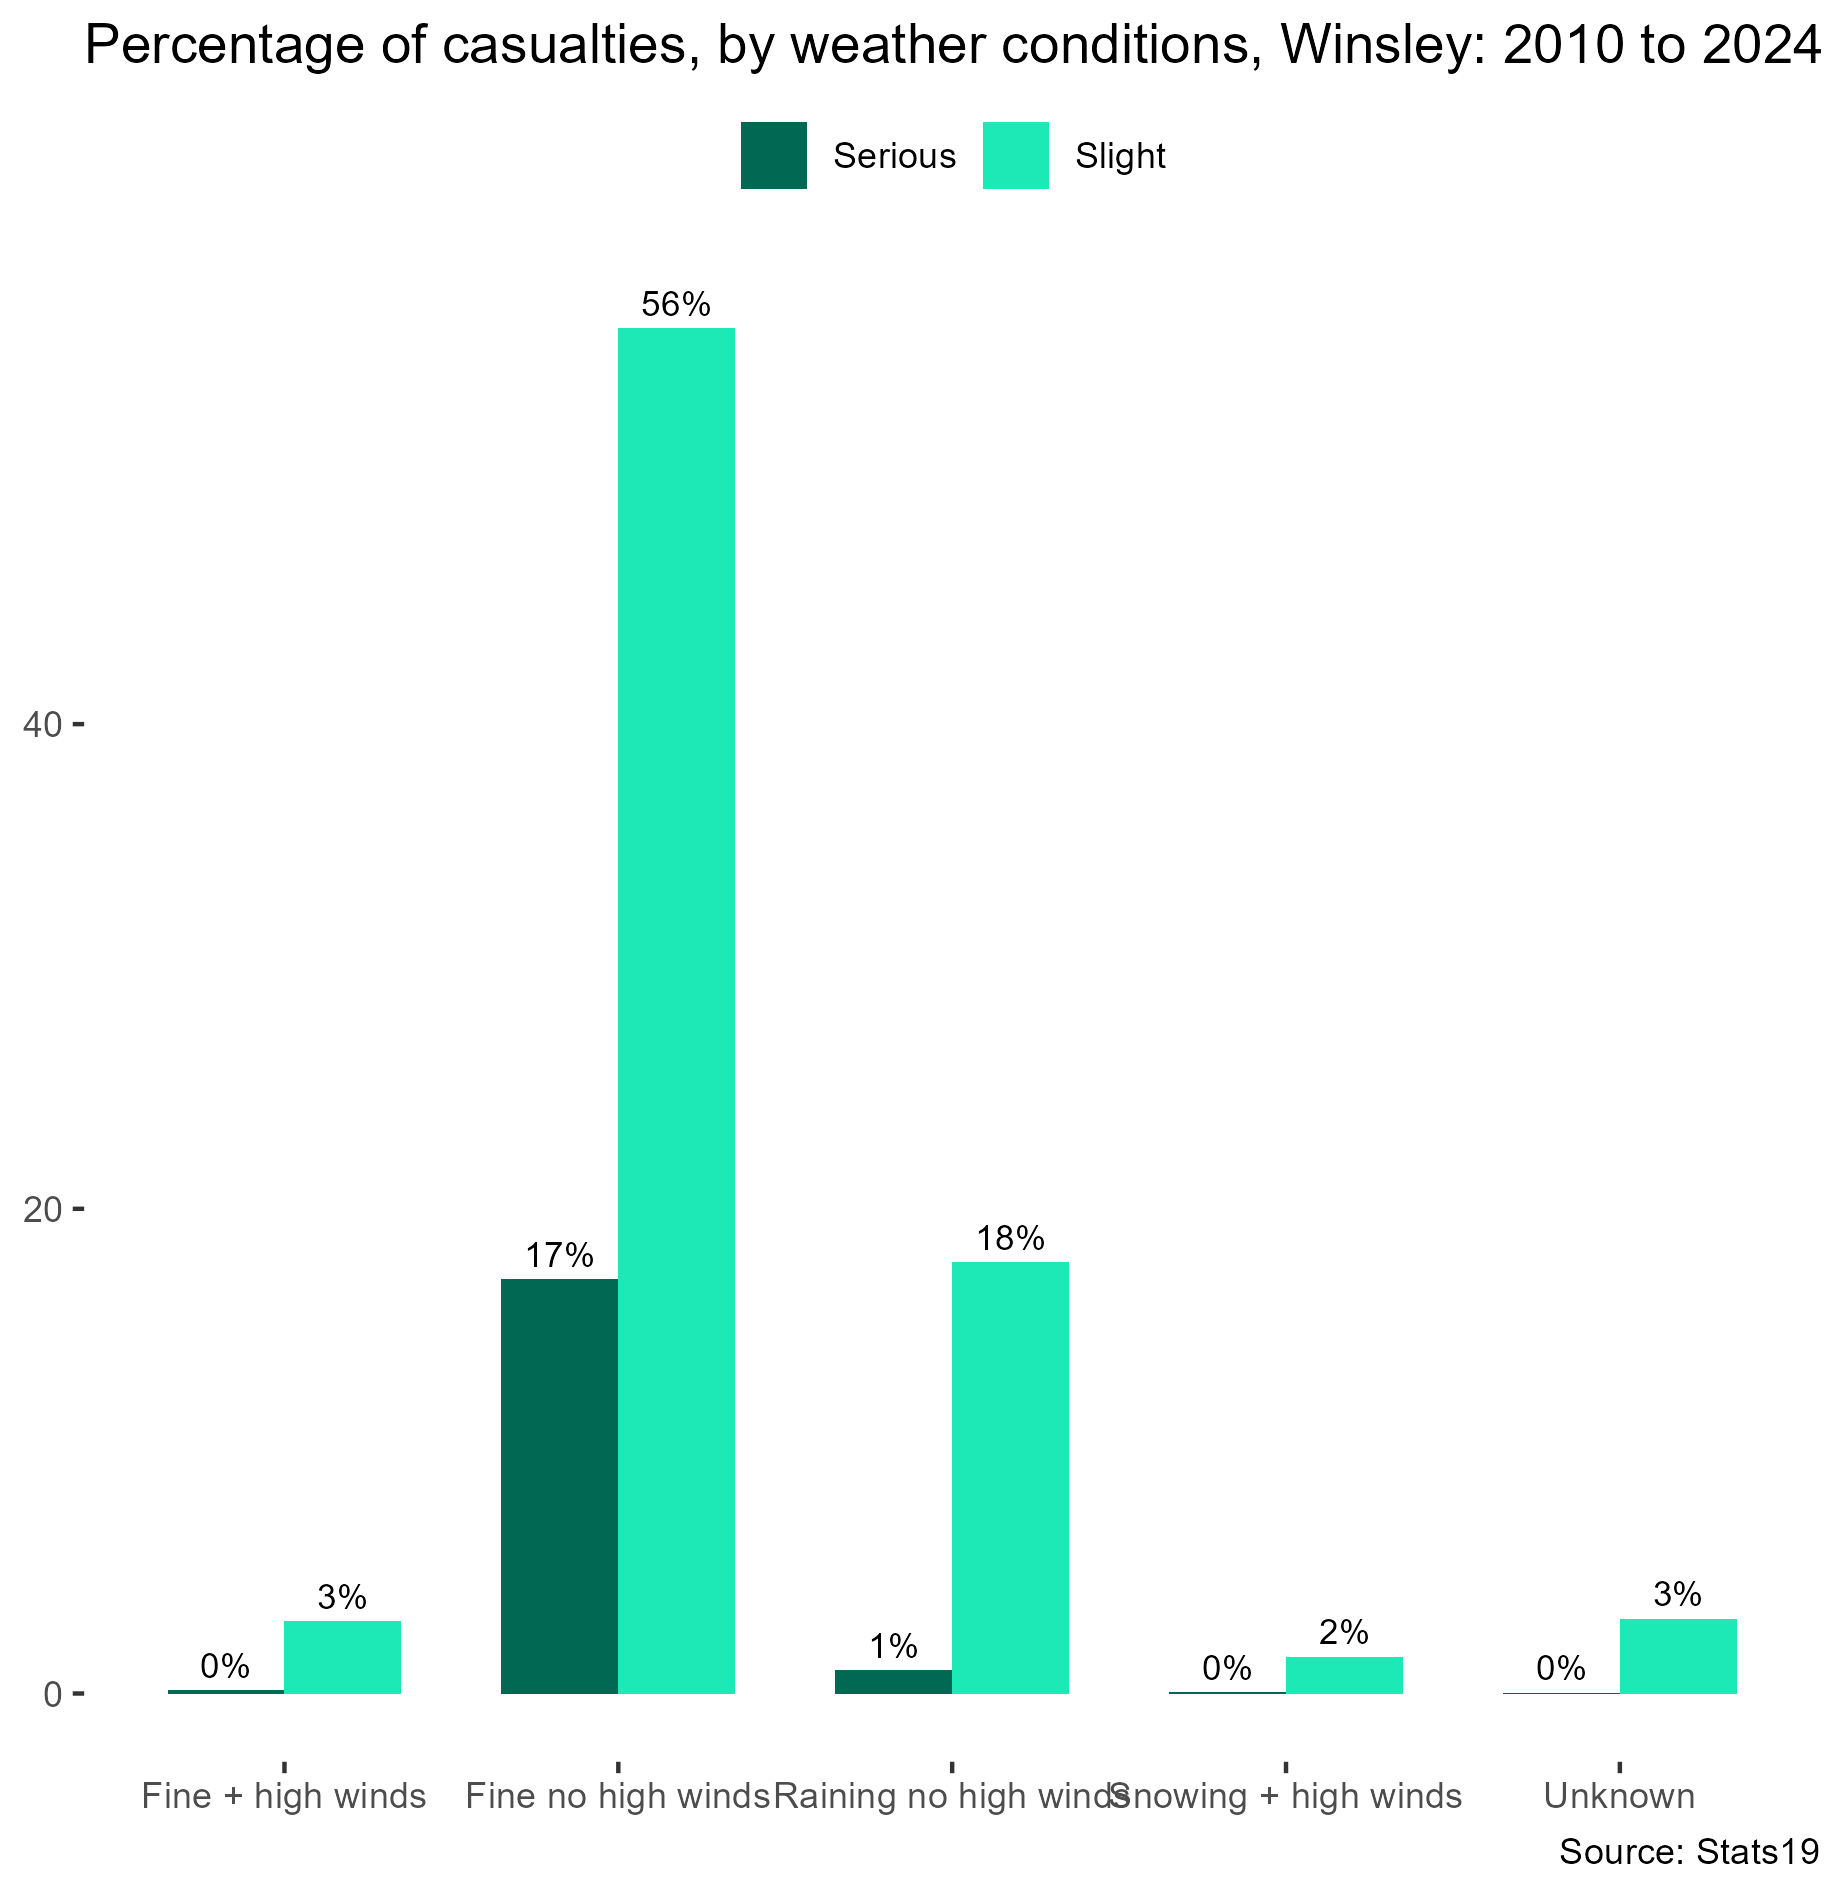
Weather conditions
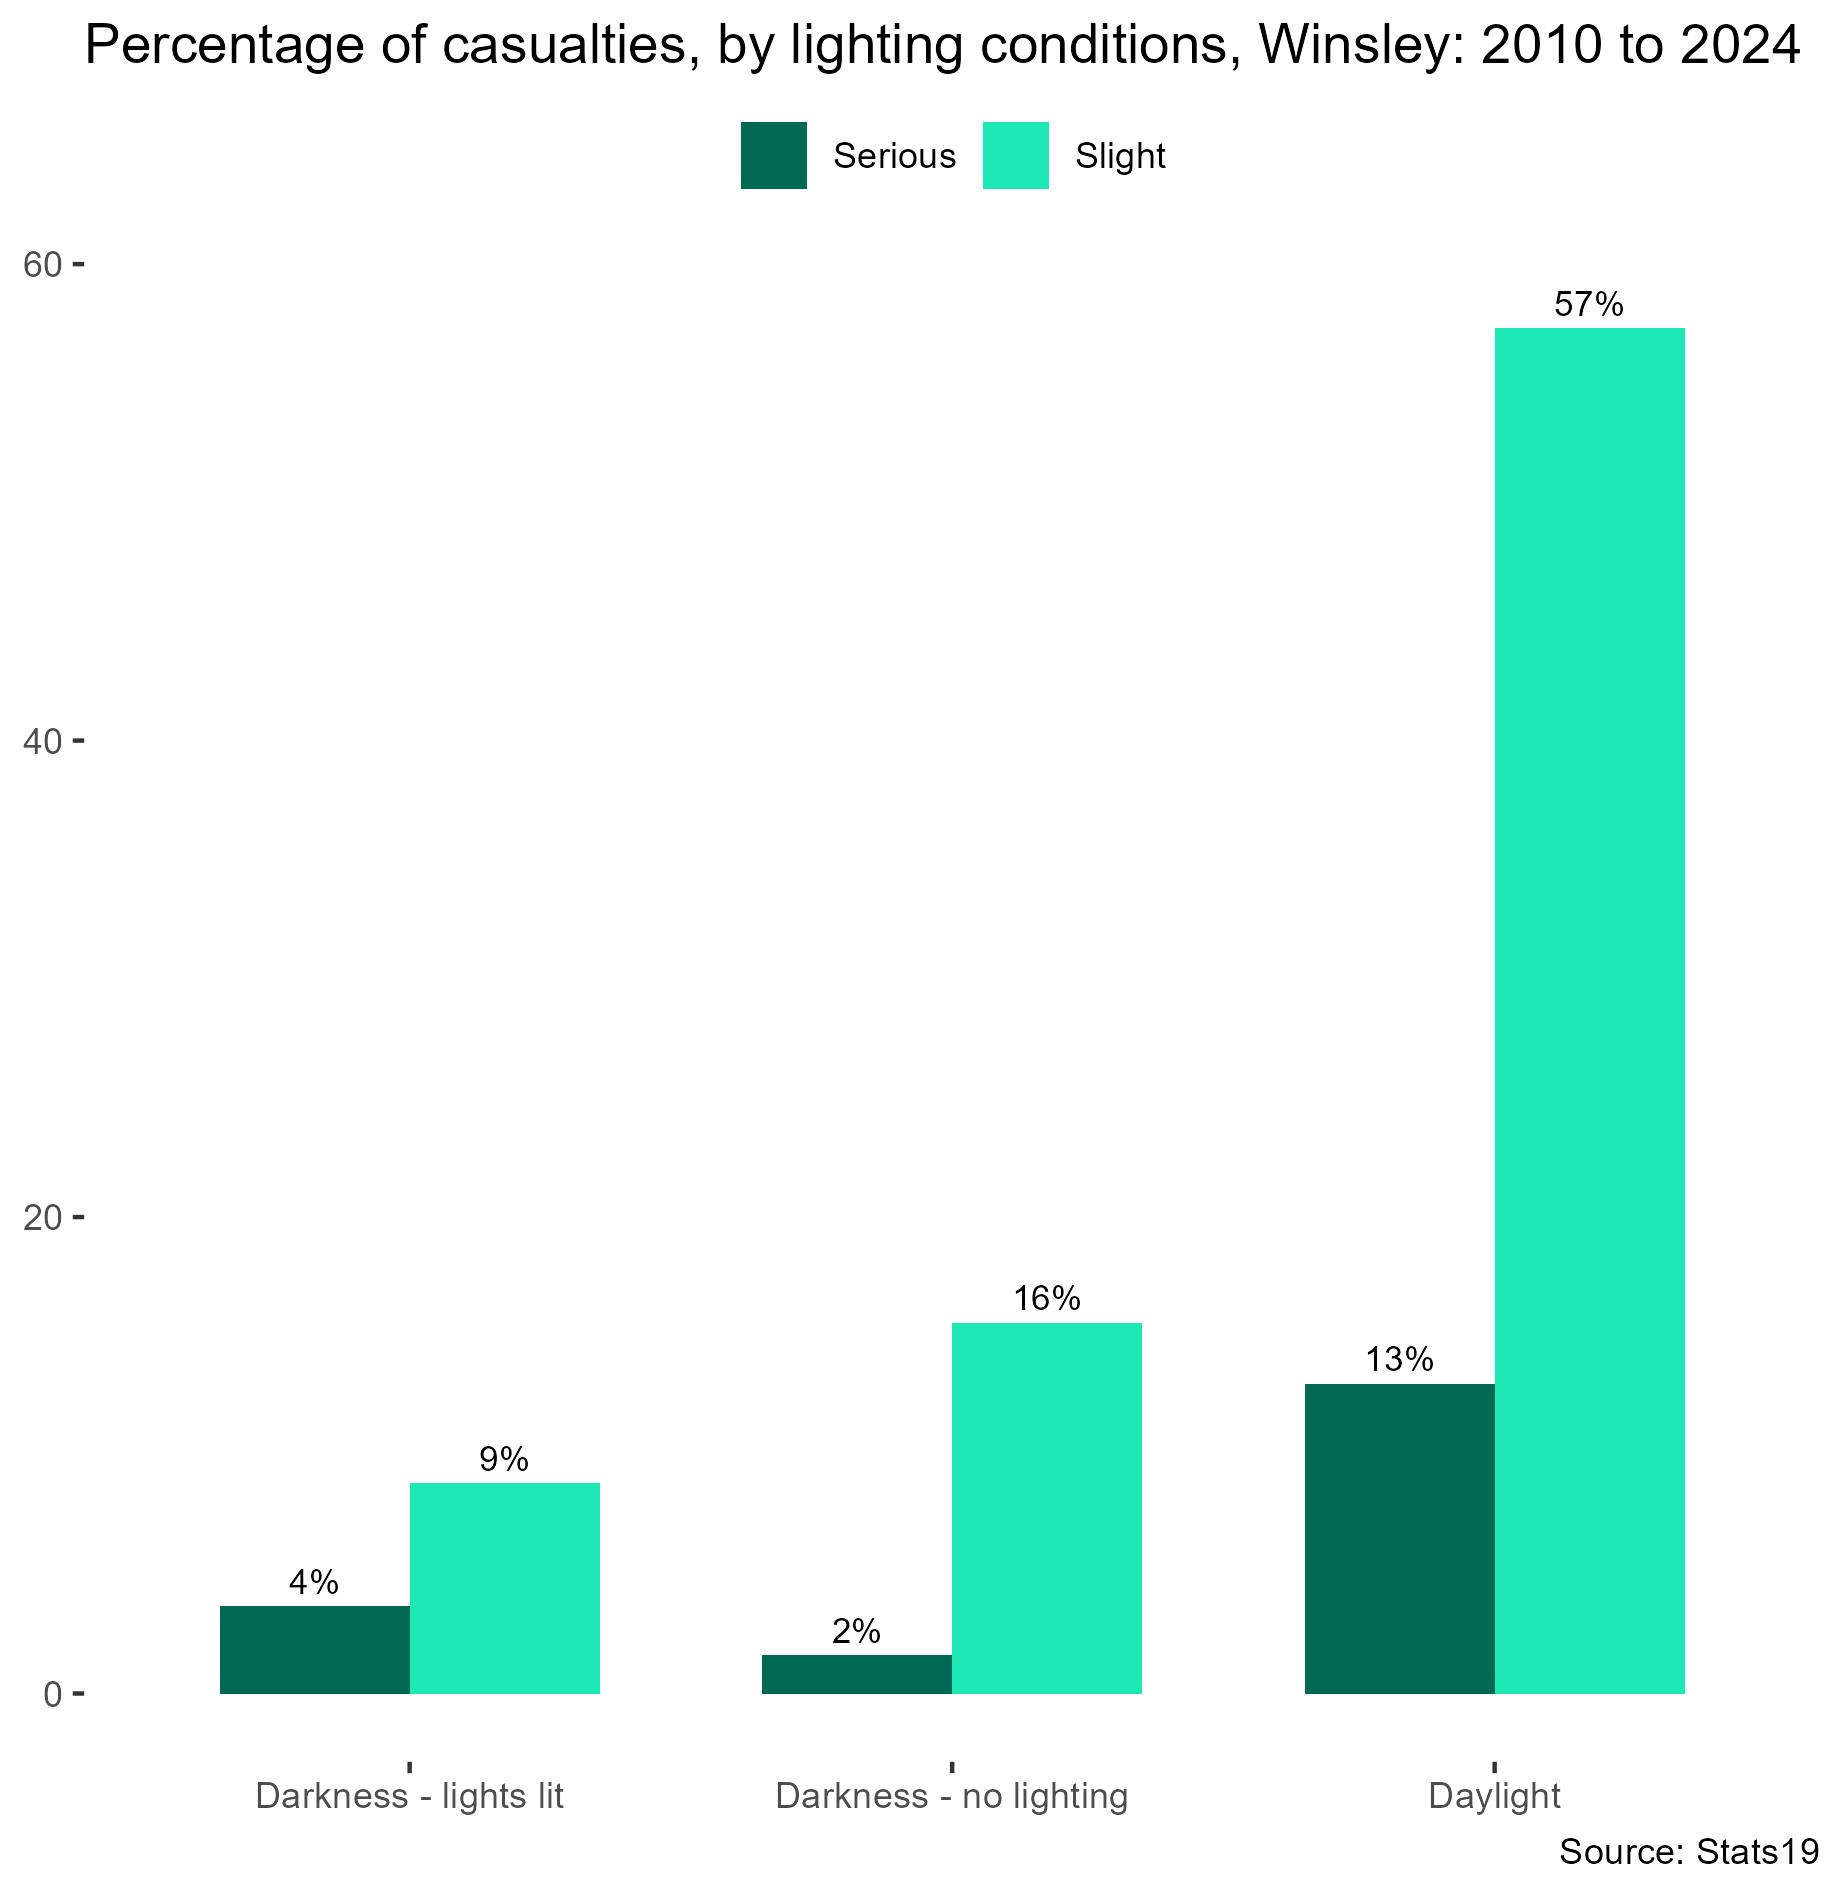
Lighting
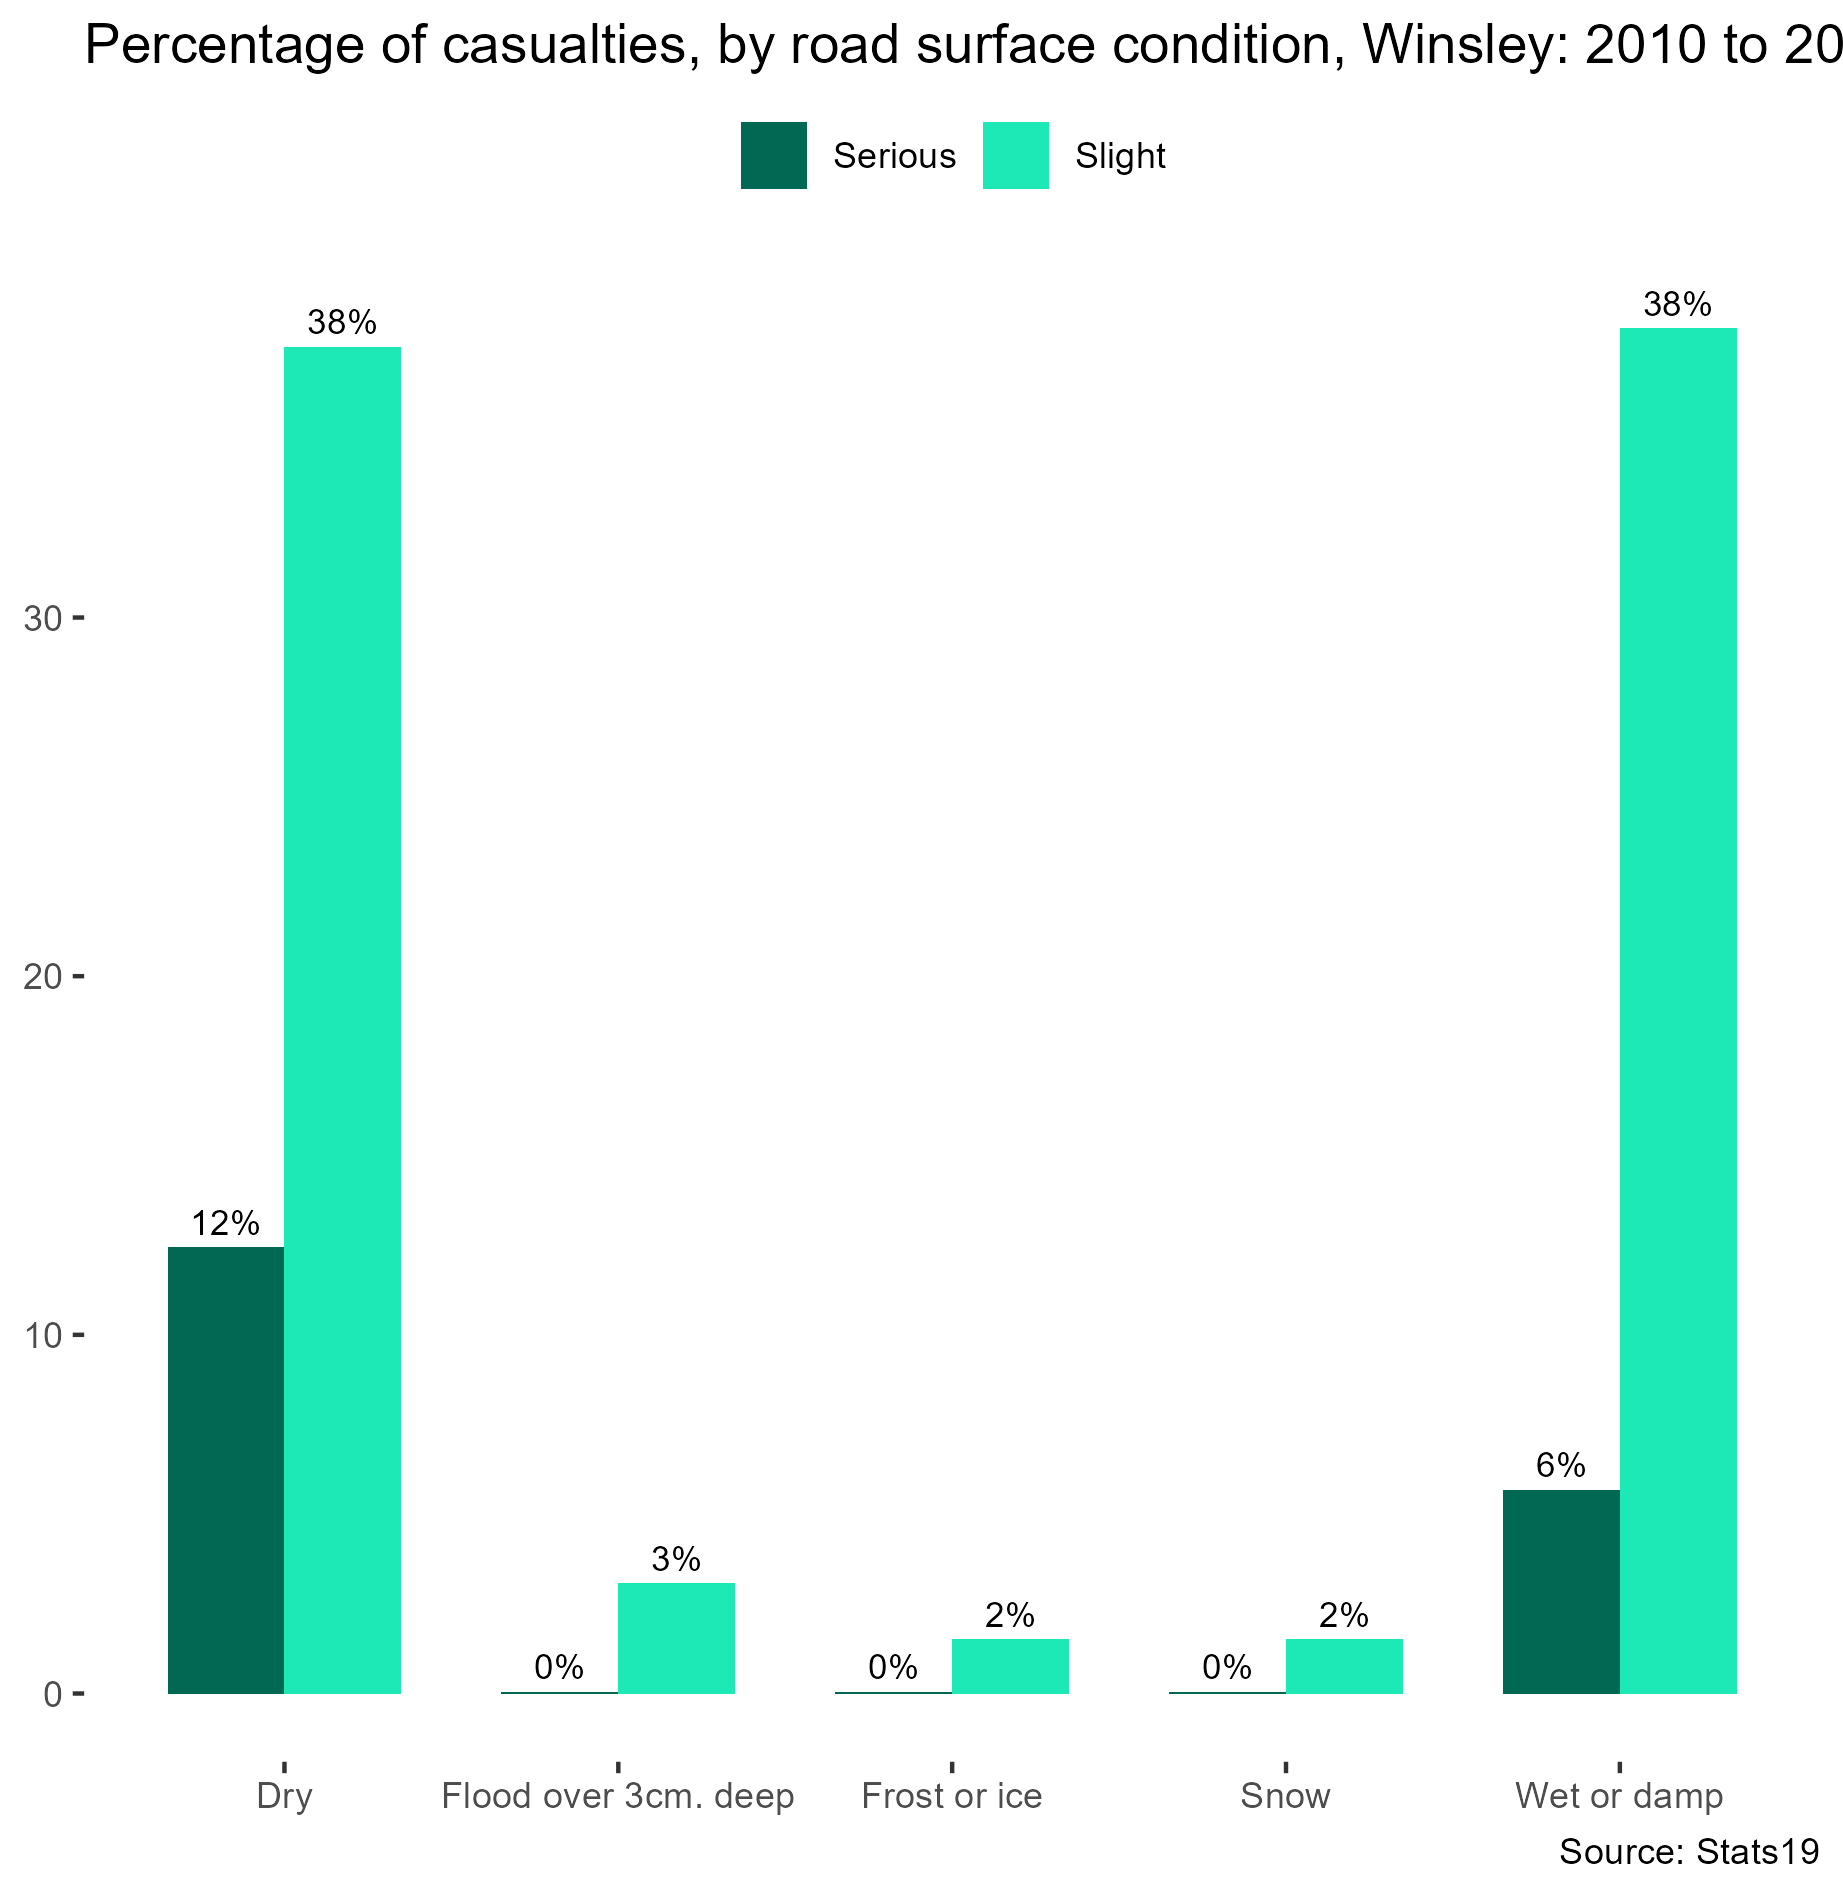
Road surface